Equity Analytics for Commercial Real Estate in 2026

Equity Analytics for Commercial Real Estate in 2026
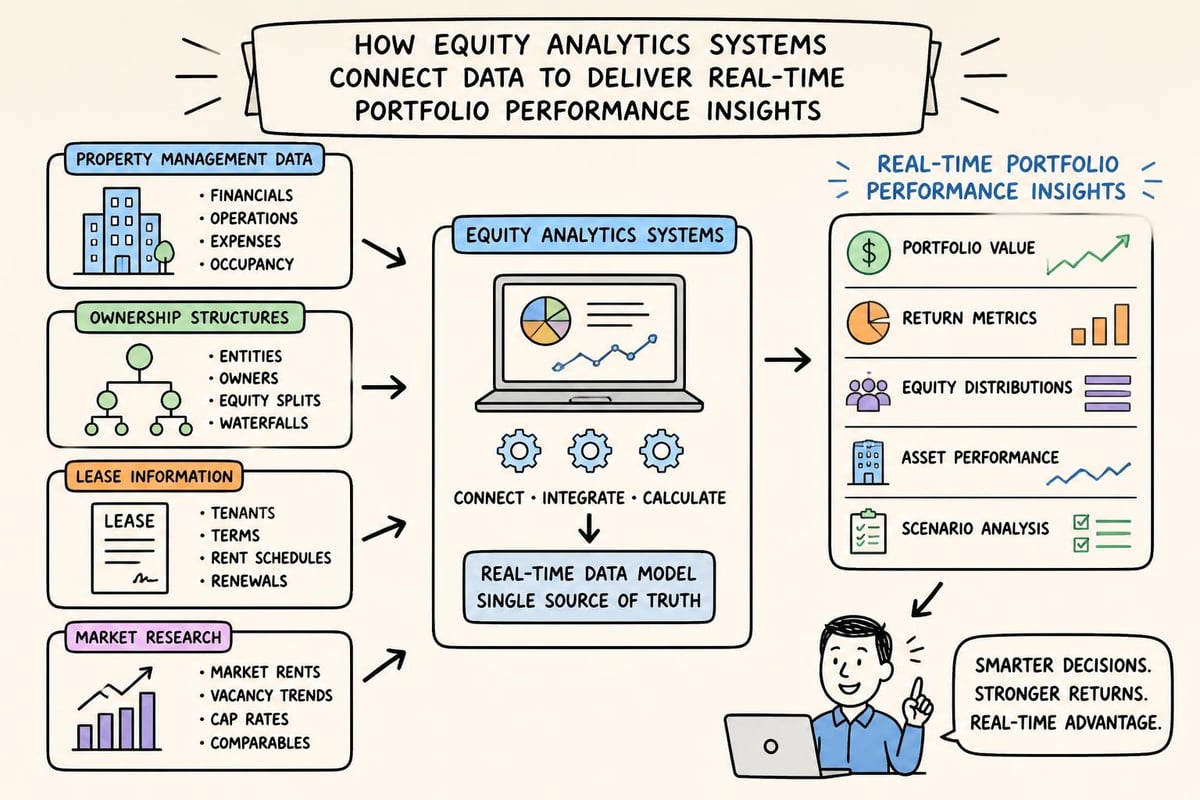
Most asset managers still analyze equity positions using static spreadsheets built in 2019. The cost? Missed refinancing windows, delayed capital calls, and portfolio decisions based on month-old assumptions. Equity analytics in commercial real estate has evolved from quarterly Excel exports to continuous, source-linked analysis that connects ownership structures, capital stacks, and performance metrics in real time. The teams winning today treat equity data as a living system, not a quarterly report.
What Equity Analytics Actually Measures in CRE Portfolios
Equity analytics tracks how ownership interests perform across properties, funds, and capital structures. For commercial real estate, this means analyzing everything from LP distributions and preferred returns to promote structures and equity multiple trajectories.
The core components include:
Ownership position tracking: Who owns what percentage across the capital stack
Cash flow attribution: How NOI translates to actual equity distributions after debt service
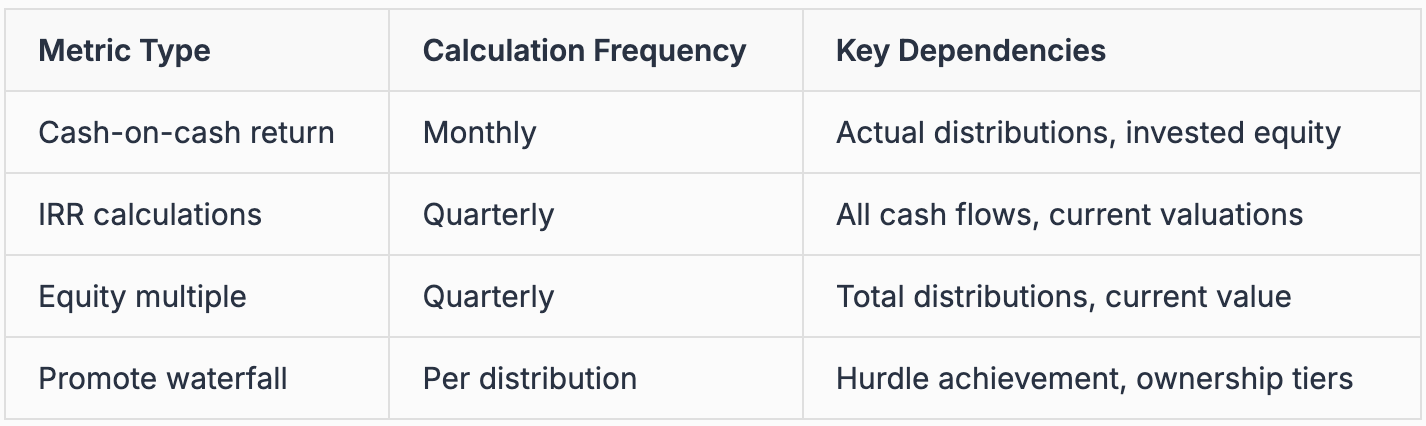
Return metrics: IRR, equity multiple, and cash-on-cash returns by investor class
Waterfall modeling: Promote calculations and preferred return hurdles
Capital call analysis: Timing and impact of additional equity contributions
Traditional equity research resources focus on public markets, but commercial real estate equity analytics operates differently. You're analyzing illiquid positions, complex partnership structures, and property-level performance that feeds up through multiple layers of ownership.
The difference between good and exceptional equity analytics comes down to data connectivity. When your equity analysis pulls from live property management systems instead of exported CSVs, you're working with current operating performance, not historical snapshots.
Source Data Integration Changes Everything
Most equity analytics workflows break down at the data collection stage. Asset managers waste hours pulling financials from Yardi, lease data from property files, and market comps from third-party services, then manually reconciling everything in Excel.
Modern equity analytics requires direct system connectivity. When you can pull actual rent rolls, operating statements, and lease terms directly from platforms like Yardi, RealPage, and Entrata, your equity analysis reflects current reality rather than last quarter's exports. Investment property analysis software that connects to these systems eliminates the reconciliation cycle entirely.
Building an Equity Analytics Framework That Scales
Asset managers overseeing 20+ properties cannot manually update equity analyses every time a lease renews or an expense variance occurs. The framework needs to scale without adding headcount.
Start with these structural elements:
Data Layer Foundation
Your equity analytics system needs clean, standardized inputs. This means:
Consistent property codes across all systems
Standardized GL account mapping
Unified investor and ownership entity naming
Regular reconciliation between PMS and accounting systems
Calculation Engine Requirements
The math behind equity analytics gets complex fast. Preferred returns compound differently than simple interest. Promote structures vary by fund. Some investors have profit participation, others don't. Your calculation engine must handle:
Reporting and Attribution
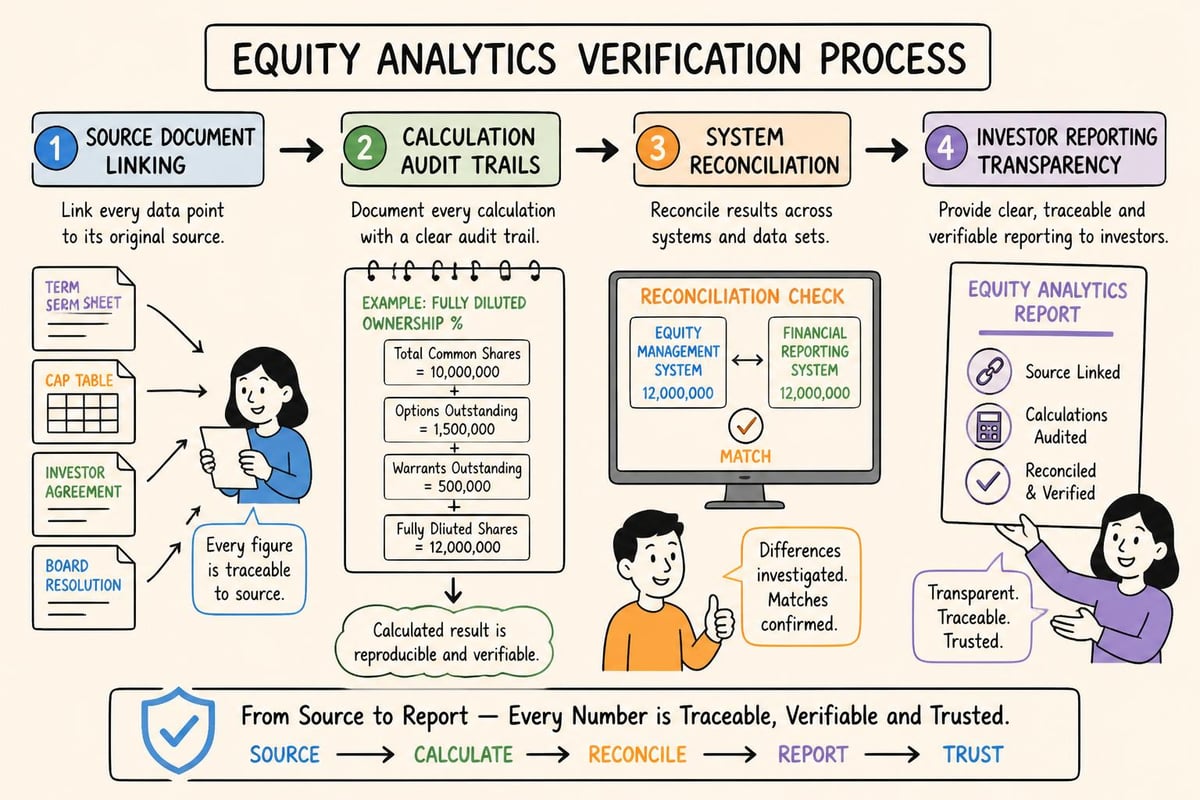
Every equity metric needs to trace back to source data. When an LP questions their Q3 distribution calculation, you should provide a direct link to the specific lease, operating statement, and waterfall calculation that produced that number. This level of verification isn't possible with traditional spreadsheet models.
Automating Multi-Step Equity Analysis
The most time-consuming equity analytics tasks involve multiple sequential steps. Calculating quarterly equity returns requires pulling current financials, updating debt balances, running waterfall calculations, and generating investor-specific reports. Each step depends on the previous one completing accurately.
Automation for these workflows goes beyond simple macros. You need systems that can execute complex, multi-step analytical processes autonomously while maintaining audit trails. When data analytics tools can handle the entire sequence from data extraction through final report generation, asset managers shift from data processing to decision-making.
Real-World Equity Analytics Applications
Acquisition Underwriting
When evaluating a new investment, equity analytics determines whether the deal meets fund return requirements. This means modeling:
Pro forma equity returns under base, upside, and downside cases
Sensitivity to key variables like exit cap rates and lease-up velocity
Impact on overall fund-level metrics and vintage year performance
Equity multiple and IRR contribution to portfolio targets
The analysis can't stop at property-level returns. You need to model how the acquisition flows through the ownership structure. If your fund has preferred returns, promote tiers, and multiple investor classes, the property-level IRR tells you nothing about actual LP returns.
Teams using AI underwriting for real estate can run dozens of equity scenarios in the time it previously took to model one, stress-testing assumptions against historical portfolio performance.
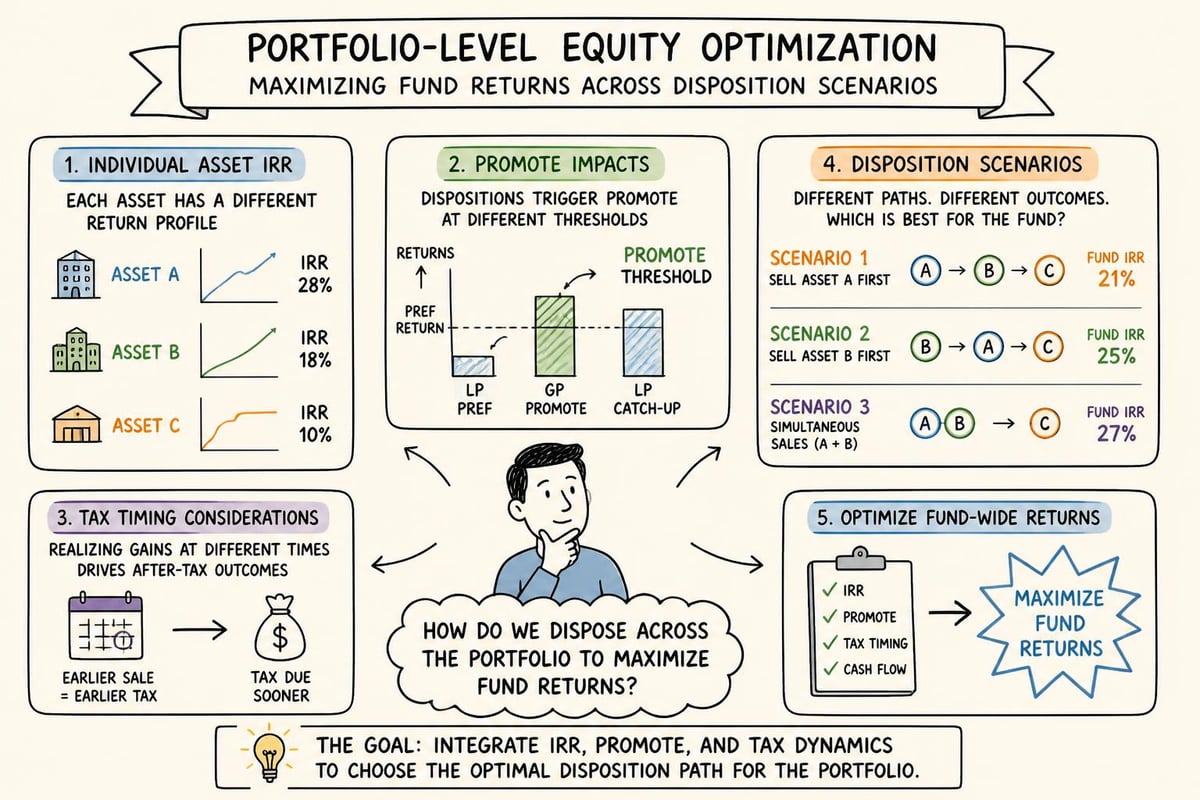
Portfolio Optimization Decisions
Which properties should you sell to maximize fund-level returns? The answer requires equity analytics across the entire portfolio, not individual asset analysis.
Consider this scenario:
Property A shows a 22% IRR but selling now triggers promotes
Property B delivers 18% IRR but no promote until year 5
Property C has negative returns but holds strategic value for another asset
Optimizing portfolio-level equity returns means understanding how each disposition decision affects the overall waterfall, tax implications, and remaining portfolio composition. Commercial real estate portfolio management requires this integrated view.
Capital Event Planning
Refinancings, capital calls, and distributions all impact equity analytics. The timing of these events can significantly affect investor returns.
Refinancing Analysis
When you refinance a property, equity analytics answers:
How does cash-out versus rate-and-term affect equity returns?
What's the optimal loan amount given current equity multiple trajectory?
How does new debt service impact future distribution capacity?
Which investor classes benefit most from the refinancing proceeds?
The calculation complexity increases with partnership structure complexity. If your JV agreement includes return-based promote triggers, the refinancing decision affects not just debt service but future promote calculations. Resources on AI for refinancing show how automated analysis can model these interconnected effects.
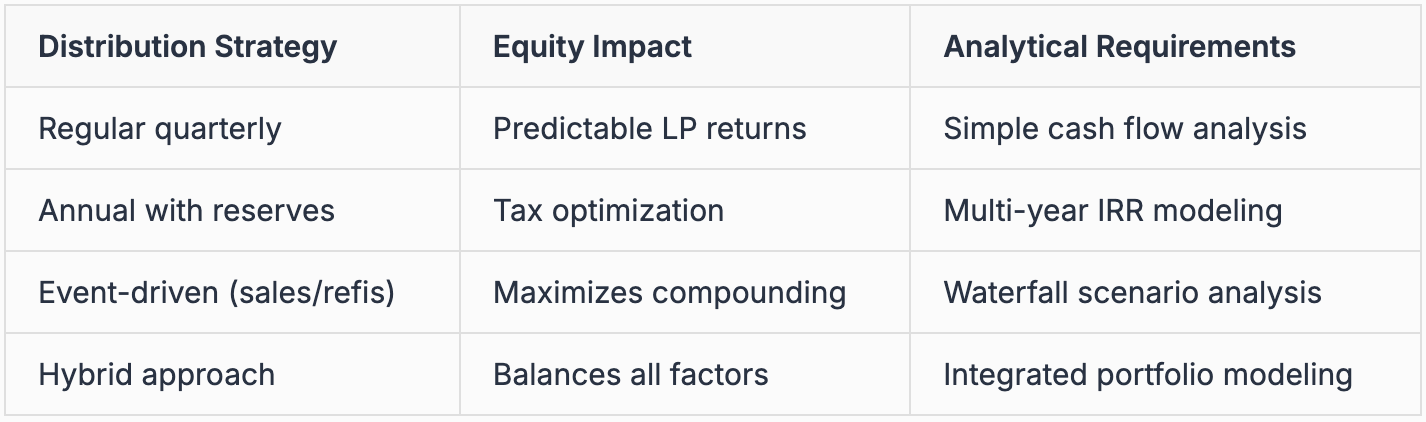
Distribution Timing Strategy
Some asset managers distribute quarterly like clockwork. Others optimize distribution timing based on tax considerations, investor needs, and fund-level return profiles. Equity analytics informs this decision by modeling:
Integrating ESG Metrics Into Equity Analysis
Institutional investors increasingly evaluate equity positions through environmental, social, and governance lenses. This adds another analytical layer to traditional financial metrics.
Equity analytics now incorporates:
Energy efficiency scores and their impact on NOI and asset values
Tenant diversity metrics for retail and office portfolios
Green building certifications and their correlation with equity returns
Carbon footprint by ownership position
Harvard Business School's sustainable investing resources provide frameworks for integrating these factors, but commercial real estate requires property-specific ESG data linked directly to equity performance. The analytical challenge lies in connecting sustainability initiatives to actual equity returns, not just reporting compliance metrics.
Data Verification and Audit Requirements
Every equity calculation must be defensible. When LPs request return documentation or auditors review fund performance, you need source-linked verification for every number.
Source Documentation Standards
Strong equity analytics systems maintain:
Direct links from calculated returns to source operating statements
Version control for all assumption changes
Time-stamped data extraction logs
Calculation methodology documentation
Audit trails for manual adjustments
This verification layer becomes critical during fund valuations, investor reporting, and liquidity events. The traditional approach of maintaining separate "support files" doesn't scale. Your equity analytics platform should embed verification into every calculation.
Reconciliation Protocols
Equity analytics outputs must reconcile to:
Property management system financials
Bank statements and actual distributions
Tax returns and K-1 allocations
Fund accounting records
Discrepancies between systems create investor questions and audit issues. Automated reconciliation identifies variances immediately rather than discovering them during year-end close.
Technology Architecture for Equity Analytics
The right technology stack determines whether equity analytics accelerates decisions or creates bottlenecks.
System Integration Requirements
Your equity analytics platform must connect to:
Property management systems (Yardi, RealPage, Entrata)
Accounting platforms for fund-level financials
Document management systems for leases and operating agreements
Market data providers for valuation inputs
Without direct integration, you're back to manual data entry and reconciliation. Real estate software for investors needs to handle these connections natively, not through monthly data dumps.
Computational Requirements
Complex equity analytics involves intensive calculations. Running Monte Carlo simulations on a 50-property portfolio with multiple investor classes and promote structures requires significant processing power. Cloud-based systems handle this better than desktop spreadsheets.
Consider these computational needs:
Scenario modeling: Testing dozens of assumption sets simultaneously
Waterfall calculations: Processing multi-tier promote structures
Portfolio optimization: Evaluating thousands of property combinations
Sensitivity analysis: Calculating return impacts across variable ranges
Security and Compliance
Equity data represents highly sensitive financial information. Your analytics platform needs enterprise-grade security, including SOC 2 Type 2 certification, role-based access controls, and comprehensive audit logging. Investor data, ownership structures, and return calculations cannot be exposed through inadequate security architecture.
Equity Analytics Workflow Optimization
The best analytics framework means nothing if the workflow creates delays. Asset managers need answers quickly, especially during acquisition windows and investment committee deadlines.
Reducing Time to Insight
Traditional equity analysis workflows involve:
Data extraction from multiple systems (2-4 hours)
Manual reconciliation and formatting (3-6 hours)
Model updates and calculations (2-3 hours)
Report generation and distribution (1-2 hours)
Total time: 8-15 hours per analysis cycle.
Optimized workflows using connected systems reduce this to minutes. When your commercial real estate deal analyzer pulls live data and runs calculations automatically, you eliminate the extraction and reconciliation steps entirely.
Standardizing Analytical Processes
Every analyst shouldn't build equity models from scratch. Standardized templates ensure consistency while allowing customization for specific situations. This standardization must include:
Approved assumption libraries for different asset classes
Standard waterfall structures by fund vintage
Consistent return calculation methodologies
Approved market data sources and update frequencies
The balance lies in maintaining analytical rigor while allowing flexibility for unique situations. Template-based approaches work for 80% of analyses, with custom modeling reserved for complex structures.
Connecting Equity Analytics to Operational Performance
The most powerful equity analytics systems connect financial outcomes to operational drivers. Understanding that equity returns declined because of higher vacancy isn't enough. You need to trace the vacancy to specific lease expirations, market conditions, and leasing velocity.
This operational connectivity means linking:
Equity return variances to specific NOI drivers
Distribution changes to lease renewal outcomes
IRR projections to planned capital improvements
Exit values to market rent growth and cap rate movements
When equity analytics integrates with real estate analytics at the operational level, asset managers identify performance issues before they materially impact returns. The system becomes predictive rather than just descriptive.
Leading Versus Lagging Indicators
Traditional equity analytics focuses on lagging indicators: actual returns, realized distributions, historical performance. Leading indicators provide earlier warning signals:
Lease rollover schedules affecting future cash flow
Market rent trends impacting renewal rates
Debt maturity calendars triggering refinancing decisions
Capital plan execution affecting value creation
Integrating both leading and lagging indicators creates a complete equity analytics picture. You understand where returns have been and where they're heading.
Building Institutional-Grade Equity Reporting
Investor reporting represents the final output of equity analytics. LPs need clear, accurate, verifiable performance information. Your reporting must balance comprehensive data with readable presentation.
Essential Reporting Components
Quarterly investor reports should include:
Summary return metrics (IRR, equity multiple, cash yield)
Cash flow detail and distribution calculations
Portfolio valuation methodology and results
Promote calculation transparency
Property-level performance attribution
Each metric needs supporting detail accessible through drill-down capabilities. When an LP questions a specific number, you should provide the underlying calculation and source data immediately.
Comparative Analysis
Institutional investors evaluate equity performance in context. Your reporting should include:
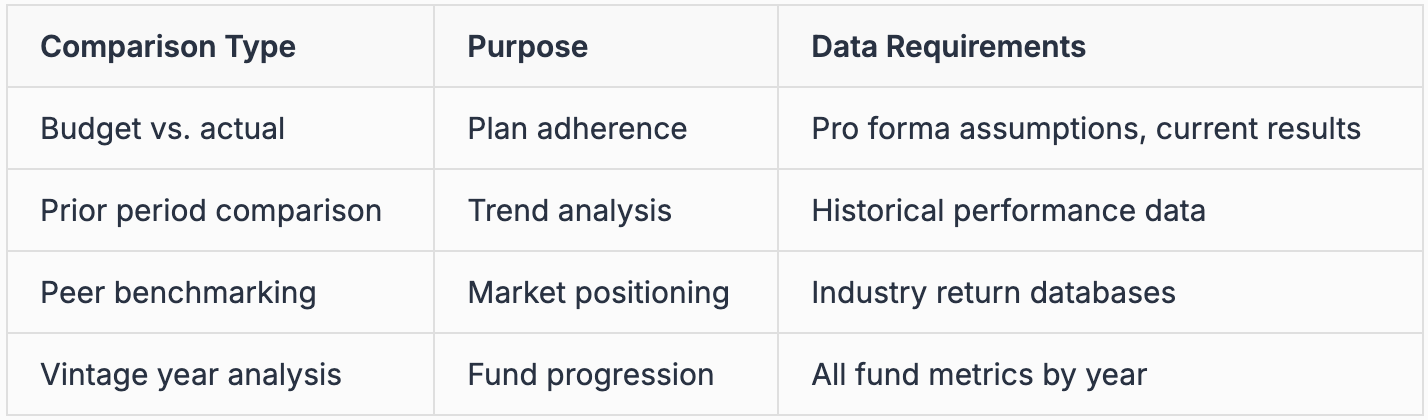
Understanding how your fund compares to private markets investment benchmarks provides context that raw returns cannot. The analytical challenge involves accessing reliable comparative data and applying appropriate normalization.
Equity analytics separates asset managers who react to portfolio performance from those who anticipate and optimize it. The discipline requires integrated data systems, rigorous calculation methodologies, and technology that handles complexity at scale. When your equity analysis connects directly to property operations, ownership structures, and market conditions through live data feeds, you make faster, better-informed capital allocation decisions. Leni delivers this integrated approach through purpose-built commercial real estate analytics that automate multi-step equity analysis while maintaining complete source verification and audit trails.

Johanna Gruber
Johanna has spent the last 8 years helping marketing teams connect with audiences through content. Specializing in B2B SaaS and real estate.
Curious About AI?
Join the largest AI community for real estate online. Get bite-sized, real-world use case videos, plus practical tips and proven strategies from top industry experts on adopting AI effectively.
MEET LENI
AI SuperAgent Purpose Built for Investors and Operators.
Experience how professionals and teams in your domain are getting the edge using AI.