Private Equity Investment Returns in CRE: A 2026 Guide

Private Equity Investment Returns in CRE: A 2026 Guide
Private equity investment returns in commercial real estate have historically outperformed public markets, but the margin of outperformance depends increasingly on operational execution rather than deal selection alone. For general partners, limited partners, and portfolio managers evaluating multifamily and institutional CRE assets in 2026, the challenge is not finding opportunities. The challenge is seeing what is happening across your portfolio fast enough to protect returns and time exits correctly. When your team waits three weeks for a variance report or manually reconciles property data from five different systems, you are making decisions on stale information. That lag compounds across dozens of properties and can erode returns by 200 to 400 basis points over a hold period.
Understanding Private Equity Investment Returns in CRE
Private equity investment returns are measured through multiple lenses, each revealing different aspects of portfolio performance. The most commonly tracked metrics include internal rate of return (IRR), equity multiple (MOIC), net operating income growth, occupancy trajectory, budget variance, and exit timing precision.
Core Return Metrics That Define Performance
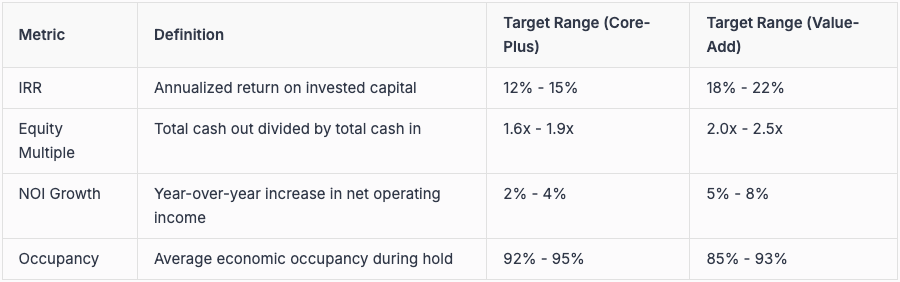
IRR measures the annualized return on invested capital, accounting for the time value of money. A 15% IRR on a five-year hold is standard for core-plus multifamily, while value-add strategies targeting 18% to 22% IRR carry higher execution risk.
Equity multiple shows total cash returned to investors divided by total cash invested. A 2.0x equity multiple means investors doubled their money, but without IRR context, you cannot assess time efficiency.
NOI growth tracks operational performance at the property level. Underwriting typically assumes 2% to 4% annual NOI growth in stabilized assets, but actual performance varies based on rent growth, expense management, and occupancy execution.
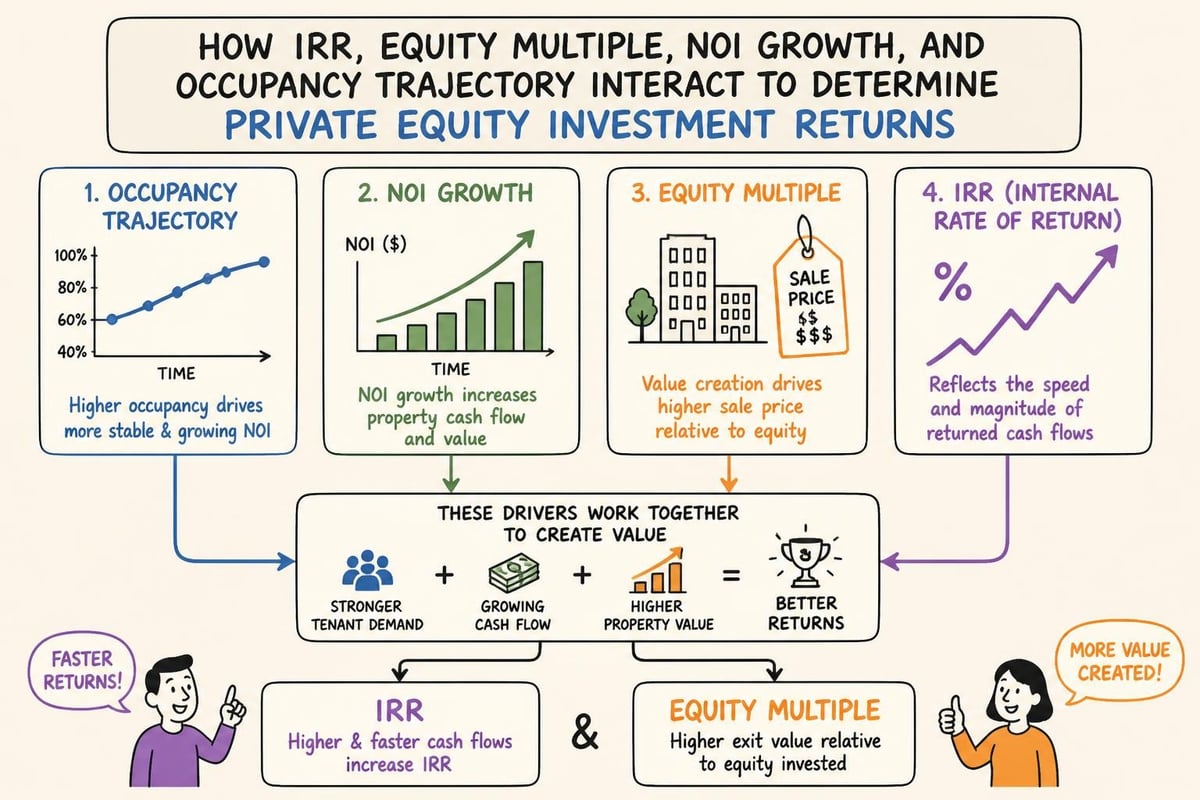
These metrics do not exist in isolation. They interact. Delayed lease-up extends your hold period, which compresses IRR even if your equity multiple hits target. Expense overruns reduce NOI growth, which impacts valuation at exit.
The Data Assembly Problem in Return Calculation
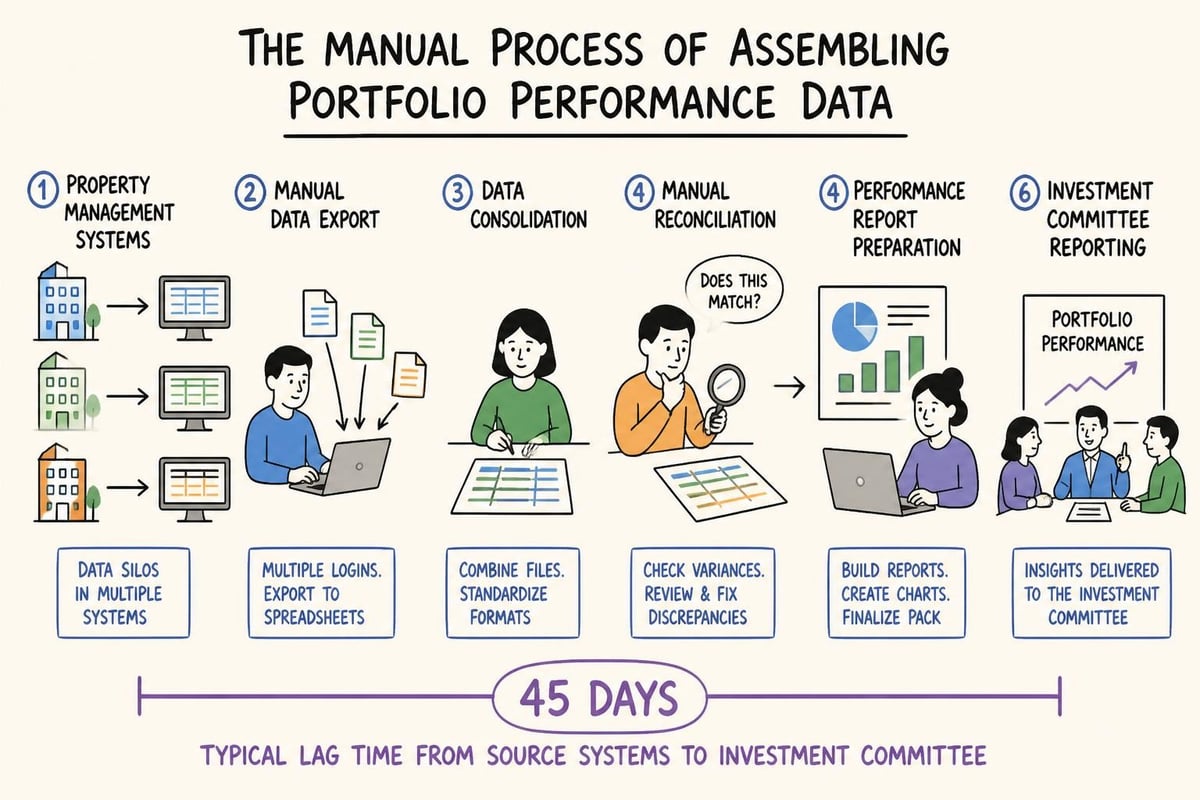
Most institutional investors track private equity investment returns using quarterly reports assembled manually from property management systems. Your portfolio manager exports data from Yardi, your analyst reconciles rent rolls from RealPage, your senior associate pulls financials from Entrata, and someone spends two days formatting everything into a consistent presentation for the investment committee.
This process introduces three problems:
Lag time: You are looking at performance data that is 30 to 45 days old by the time it reaches decision-makers
Error accumulation: Manual data entry and reconciliation across systems creates version control issues and calculation mistakes
Inconsistent definitions: Different properties measure occupancy, collections, and expenses differently, making portfolio-level aggregation unreliable
When markets moved slowly and information asymmetry created value, this lag was acceptable. In 2026, with pricing data available in real time and capital markets repricing assets weekly, delayed visibility costs you returns.
Return Drivers Private Equity Teams Must Track
Generating superior private equity investment returns requires monitoring leading indicators, not just lagging financial results. Investment committees need to see what will impact returns before it shows up in quarterly NOI.
Occupancy Trajectory and Lease Velocity
Occupancy is not a single number. It is a trend with directional momentum. A property sitting at 88% occupancy could be improving from 82% three months ago or declining from 93%. The trajectory tells you whether your value-add execution is on track.
Lease velocity measures how quickly you are converting traffic to signed leases. If site visits are up but lease conversions are down, you have a pricing problem or a competitor offering better concessions. That signal appears 60 to 90 days before it impacts occupancy rates, and 120 days before it impacts NOI.
Property management systems track this data, but most investment teams only see it when they request a custom report. By then, you have lost the window to adjust pricing or marketing spend.
Budget Variance and Expense Control
Underwriting models assume expense ratios based on historical data and market benchmarks. Actual expenses rarely match assumptions exactly, but the pattern of variance tells you whether you have a systemic problem.
A property running 5% over budget on repairs and maintenance every quarter is not experiencing bad luck. It is experiencing poor vendor management, deferred maintenance you did not underwrite, or scope creep in the capital plan.
Variance explanations matter as much as the variance itself. A 10% increase in insurance premiums driven by market-wide rate hikes is different from a 10% increase driven by claims frequency at your property. One is unavoidable, the other is operational execution failure.
Rent Growth Relative to Underwriting
Most underwriting models assume rent growth tied to inflation or market rent surveys. Actual rent growth depends on your ability to push rents without triggering excess turnover or concession pressure.
Monitor renewal rates and renewal rent increases separately from new lease rates
Track effective rent (gross rent minus concessions) rather than face rates
Compare your rent growth to submarket averages, not just to your own underwriting
If your property is achieving 4% rent growth while the submarket is achieving 6%, you are leaving returns on the table. If you are achieving 8% while the market is achieving 6%, you may be creating churn risk that will show up in occupancy declines six months later.
How Data Lag Erodes Private Equity Investment Returns
The time between when something happens in your portfolio and when your investment team sees it creates a decision-making gap that compounds across the hold period.
The 45-Day Information Delay
Consider a typical quarterly reporting cycle for a 12-property multifamily portfolio:
Day 0-10: Property managers close the month in their respective systems (Yardi, RealPage, AppFolio)
Day 10-20: Regional managers review property-level reports and request corrections
Day 20-30: Portfolio analyst exports data and begins reconciliation across properties
Day 30-40: Senior associate builds variance analysis and return projections
Day 40-45: Investment committee reviews performance and discusses action items
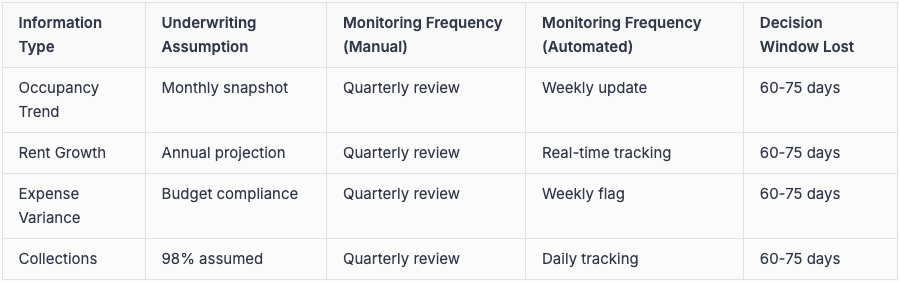
By day 45, you are looking at performance data from 60 to 75 days ago. If a property experienced a maintenance emergency that spiked expenses in week two of the quarter, your IC is discussing it ten weeks later. The opportunity to mitigate impact has passed.
Opportunity Cost of Manual Assembly
The direct cost of manual portfolio reporting is the analyst time spent on data assembly rather than analysis. The indirect cost is the investment decisions you do not make because you lack timely information.
When active real estate investing strategies require constant portfolio optimization, delayed data visibility means delayed action. You cannot adjust management teams, reprice units, or accelerate exit timelines based on information that is two months old.
Connecting Portfolio Data to Investment Decisions
Superior private equity investment returns come from connecting operational data directly to investment decision-making without manual translation layers. This requires infrastructure that treats portfolio monitoring as a continuous process, not a quarterly event.
Automated Variance Flagging Against Underwriting
Every private equity investment begins with an underwriting model that makes explicit assumptions about rent growth, expense ratios, occupancy stabilization, and exit cap rates. These assumptions represent your return thesis. Variance from these assumptions represents thesis risk.
Automated monitoring systems should flag variance in real time:
Rent growth trending 100 basis points below underwriting for two consecutive months
Occupancy stabilization delayed beyond the projected timeline
Expense ratios exceeding underwritten assumptions by more than 5%
Capital expenditure burns faster than the phased budget plan
These flags do not require human interpretation. They are objective deviations from stated assumptions. The investment team can then investigate root causes and decide whether to adjust operations, revise projections, or prepare for early exit.
Portfolio-Level Aggregation for Multi-Asset Funds
Fund-level private equity investment returns depend on portfolio construction and correlation between assets. A fund with 15 properties cannot wait for quarterly reviews to understand whether portfolio-level performance is on track.
Institutional investors need to see:
Weighted average IRR across all portfolio companies based on current performance
Distribution waterfalls showing when the fund will hit preferred return hurdles
Exit timing scenarios modeling how accelerating or delaying individual asset sales impacts fund-level returns
Risk concentration identifying whether underperformance is isolated or systemic
This level of analysis is impossible when data from each property sits in different systems with different definitions and formats. Portfolio monitoring requires a unified data layer that normalizes inputs across the entire portfolio.
AI-Powered Portfolio Intelligence for Return Optimization
Traditional portfolio monitoring treats data assembly as separate from data analysis. You build the report, then you analyze the report. This separation creates the lag that erodes returns.
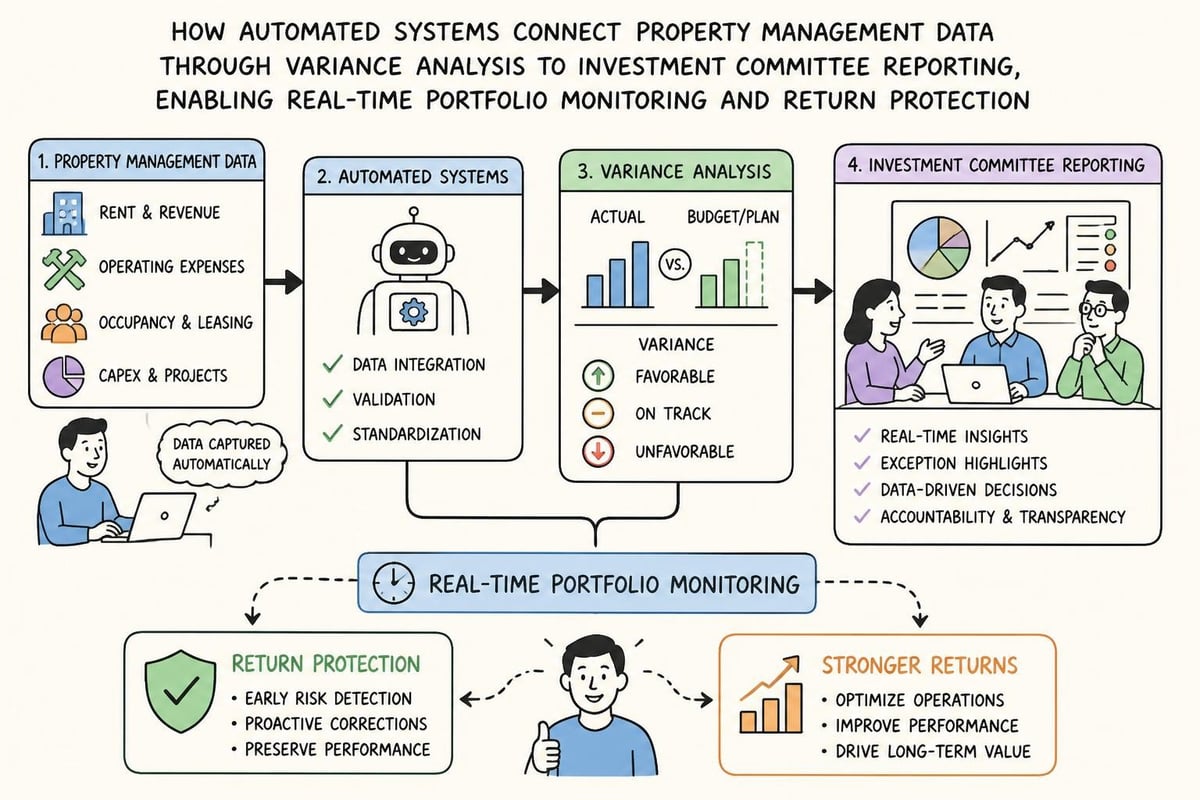
Modern portfolio intelligence platforms connect directly to property management systems to automate the entire flow from data extraction to decision-ready outputs. This is not business intelligence dashboards showing last quarter's numbers. This is AI-powered systems that flag variance, explain changes, and produce investment committee materials without manual assembly.
Direct Integration with Property Management Systems
The foundation of automated portfolio monitoring is direct integration with the systems where operational data lives. For most institutional CRE portfolios, that means Yardi Voyager, RealPage OneSite, Entrata, and AppFolio.
These integrations enable:
Real-time rent roll extraction showing current occupancy, lease expirations, and renewal rates
Automated financial statement pulls capturing income, expenses, and NOI without manual export
Variance calculations comparing actual performance to underwriting assumptions at the property and portfolio level
Trend analysis identifying whether metrics are improving, stable, or declining
When these data flows run automatically, your investment team sees portfolio performance as it happens rather than six weeks after it happens. That visibility creates the opportunity to intervene before small variances compound into return erosion.
Validated Assumptions and Risk Flagging
Underwriting models contain hundreds of assumptions. Market rent growth. Turnover rates. Expense inflation. Cap rate compression. Most of these assumptions are educated guesses based on market research and historical data.
AI-powered portfolio monitoring validates these assumptions continuously by comparing them to actual performance across your portfolio. When actual data diverges from assumptions, the system flags the variance and quantifies the impact on projected returns.
For example, if you underwrite 3% annual rent growth but your portfolio is achieving 1.8% rent growth across six consecutive months, the system should automatically:
Flag the variance against the original assumption
Calculate the impact on projected NOI at exit
Recalculate IRR and equity multiple based on revised rent growth
Surface properties where the variance is most severe
This type of continuous assumption validation is what separates teams that protect returns from teams that discover underperformance after it is too late to correct.
Exit Timing and Return Maximization
Private equity investment returns are realized at exit, not during the hold period. Optimal exit timing requires understanding both when your asset has maximized value and when market conditions support achieving that value.
Monitoring Market Windows for Exit Execution
Exit timing depends on two factors: asset-level performance hitting stabilization targets and market conditions supporting your exit cap rate assumptions. You control the first, you monitor the second.
Asset-level exit readiness indicators include:
Occupancy stabilized at or above underwritten levels for at least two quarters
NOI growth trending at or above underwritten projections
Lease expiration schedule showing minimal near-term rollover risk
Capital expenditure plans completed or substantially complete
Market condition indicators include:
Transaction volume and cap rate trends in your submarket
Debt market conditions affecting buyer financing availability
Comparable sales showing pricing consistent with your exit assumptions
When both conditions align, you have an exit window. When asset performance is ready but market conditions are weak, you optimize operations and wait. When markets are strong but asset performance lags, you accelerate operational improvements or accept a discounted exit.
The ability to make this judgment requires real-time visibility into both asset performance and market conditions. Teams operating on quarterly reporting cycles miss exit windows because they do not see the opportunity until it has passed.
Scenario Modeling for Hold-Sell Decisions
Every quarter, investment committees should evaluate hold-versus-sell decisions for each asset in the portfolio. This evaluation requires running multiple scenarios:
Hold 12 months: Projected returns if you continue operations and exit in four quarters
Hold 24 months: Projected returns if you extend hold period to further optimize value
Exit now: Projected returns based on current market pricing
These scenarios depend on accurate current performance data, reliable market pricing information, and the ability to model future cash flows under different operational assumptions. When data assembly takes three weeks, scenario modeling becomes a special project rather than a standard quarterly practice.
According to research on private equity returns, the illiquidity premium in private equity averages approximately 5% per annum over public equities. This premium compensates investors for reduced liquidity, but it also creates opportunity cost if you hold assets past optimal exit timing. Getting exit timing right matters as much as buying right.
Industry Perspectives on Return Expectations
Private equity investment returns vary significantly based on strategy, asset class, and market cycle. Understanding current return expectations helps calibrate performance targets and portfolio construction.
Current Return Benchmarks Across Strategies
KKR's analysis of private equity diversification projects continued outperformance over public markets through 2030, driven by the illiquidity premium, active ownership capabilities, and strategic portfolio construction. For commercial real estate specifically, core-plus strategies target net IRRs of 12% to 15%, while opportunistic strategies target 20% or higher.
Vanguard's measured outlook emphasizes the importance of rigorous manager selection and diversification, projecting high-single-digit annualized returns for diversified private equity portfolios over the next decade. This more conservative projection reflects increased competition for assets and compressed entry cap rates in many markets.
Deal Volume and Market Conditions
KPMG's quarterly pulse on private equity shows declining deal volume but resilience in deal values, with strategic focus on sectors like infrastructure and specialized real estate. For CRE investors, this translates to fewer but larger transactions, with capital concentrated in proven strategies and top-quartile managers.
Limited partners are adjusting return expectations downward based on recent performance data and market conditions. This recalibration affects fundraising dynamics and increases pressure on general partners to demonstrate operational value creation rather than relying solely on leverage and market appreciation.
Operational Execution as Return Driver
The shift from financial engineering to operational value creation means that private equity investment returns increasingly depend on execution capabilities. Teams that can identify operational improvement opportunities, implement changes quickly, and track results in real time outperform those relying on quarterly reports and annual business plans.
Moving From Quarterly Reviews to Continuous Monitoring
Traditional portfolio management operates on a quarterly cycle. Review performance, discuss variances, approve action items, implement changes, wait three months, repeat. This cycle made sense when information flow was slow and decision-making was centralized.
In 2026, the competitive advantage goes to teams that monitor continuously and intervene immediately. When a property experiences declining lease conversion rates, the response should happen within days, not quarters. When expense variance indicates vendor pricing issues, the procurement review should start immediately.
Continuous monitoring requires:
Automated data extraction from property management systems
Real-time variance flagging against underwriting assumptions
Workflow automation routing issues to appropriate decision-makers
Performance tracking measuring the impact of corrective actions
This operational tempo is impossible with manual reporting processes. It requires infrastructure that treats data as a continuous flow rather than quarterly snapshots.
Integration With Investment Operations Workflows
Portfolio monitoring does not exist in isolation. It connects to underwriting, reporting, investor relations, and asset management workflows. When these workflows are disconnected, information gets lost, decisions get delayed, and returns suffer.
Modern investment operations platforms integrate portfolio monitoring with:
Underwriting systems showing variance between actual performance and original projections
Reporting systems generating quarterly investor letters and capital account statements
Market research platforms providing comparable transaction data for exit timing decisions
Portfolio analytics aggregating performance across funds and vintage years
Teams using AI-powered real estate investment tools report 40% to 60% reduction in time spent on portfolio reporting and corresponding improvement in decision-making speed. This efficiency translates directly into return protection through faster identification and resolution of operational issues.
Building Data Infrastructure for Return Optimization
Superior private equity investment returns require treating data infrastructure as a strategic investment rather than a back-office cost center. The firms generating top-quartile returns in 2026 are those that built technology stacks connecting portfolio data directly to investment decision-making.
Core Components of Modern Portfolio Infrastructure
A complete portfolio data infrastructure includes five layers:
Data extraction: Automated connections to property management systems, accounting platforms, and market data sources
Data normalization: Translation of different system formats into consistent definitions and structures
Analytics engine: Calculation of return metrics, variance analysis, and performance projections
Reporting automation: Generation of investment committee materials, investor reports, and portfolio dashboards
Workflow orchestration: Routing of exceptions, approvals, and action items to appropriate team members
Each layer builds on the previous one. You cannot automate reporting if you have not normalized data. You cannot normalize data if you have not automated extraction. Most firms have built partial solutions addressing one or two layers, creating gaps that require manual intervention.
Selecting Technology Partners for Portfolio Monitoring
The market for real estate investment analysis software includes dozens of vendors offering portfolio monitoring, analytics, and reporting capabilities. Evaluating these solutions requires understanding whether they solve the full workflow or create additional integration challenges.
Key evaluation criteria include:
Native integrations with your existing property management systems (Yardi, RealPage, Entrata, AppFolio)
Automated variance flagging against underwriting assumptions without manual configuration
Investment committee ready outputs that replace manual report assembly rather than adding another dashboard
Enterprise security meeting institutional requirements for data handling and access controls
Industry context understanding commercial real estate workflows and terminology
Generic business intelligence tools require extensive customization to handle real estate workflows. Purpose-built platforms designed for CRE investment teams deliver value faster with less ongoing maintenance.
Quantifying the Return Impact of Portfolio Visibility
The connection between data infrastructure and private equity investment returns is difficult to measure directly because you cannot run controlled experiments with portfolio companies. However, the impact manifests in measurable ways across the investment lifecycle.
Time Savings and Efficiency Gains
The most immediate benefit of automated portfolio monitoring is time savings in report assembly. Teams spending 80 to 120 hours per quarter on portfolio reporting can reduce that to 10 to 20 hours with proper automation.
This efficiency creates capacity for higher-value activities:
Deeper analysis of underperforming assets identifying root causes and solutions
More frequent scenario modeling supporting better hold-sell decisions
Enhanced investor reporting providing transparency that strengthens LP relationships
Proactive market research identifying emerging opportunities and risks
The compounding effect of reallocating senior team time from data assembly to strategic analysis shows up in better capital allocation decisions and improved portfolio returns.
Risk Mitigation Through Early Warning Systems
Portfolio monitoring infrastructure protects returns by identifying problems before they compound. A maintenance issue caught in month one costs $10,000 to fix. The same issue ignored for six months costs $50,000 and triggers resident complaints that impact occupancy.
Common risks that automated monitoring catches early:
Collection rates declining indicating resident quality or economic stress
Lease conversion rates dropping suggesting pricing or competitive issues
Expense ratios creeping up indicating vendor management or scope control problems
Turnover rates increasing signaling resident satisfaction or property condition issues
Each of these risks, if left unaddressed for a full quarter, can erode 50 to 150 basis points of return over a typical hold period. Catching them early through automated flagging protects the return profile assumed in underwriting.
Private equity investment returns in commercial real estate depend on execution speed and data accuracy as much as deal selection and market timing. Teams that see portfolio performance in real time can protect returns through faster intervention and better exit timing decisions. Leni connects directly to your property management systems to automate portfolio monitoring, flag variance against underwriting assumptions, and produce investment committee ready reports without manual assembly. Built for enterprise-grade CRE and investment teams, Leni helps you turn portfolio data into decision-ready outputs faster so you can focus on protecting and optimizing returns across your portfolio.

Johanna Gruber
Johanna has spent the last 8 years helping marketing teams connect with audiences through content. Specializing in B2B SaaS and real estate.

Curious About AI?
Join the largest AI community for real estate online. Get bite-sized, real-world use case videos, plus practical tips and proven strategies from top industry experts on adopting AI effectively.
MEET LENI
AI SuperAgent Purpose Built for Investors and Operators.
Experience how professionals and teams in your domain are getting the edge using AI.
