Property Management Investment: Data Architecture Guide
Property Management Investment: Data Architecture Guide
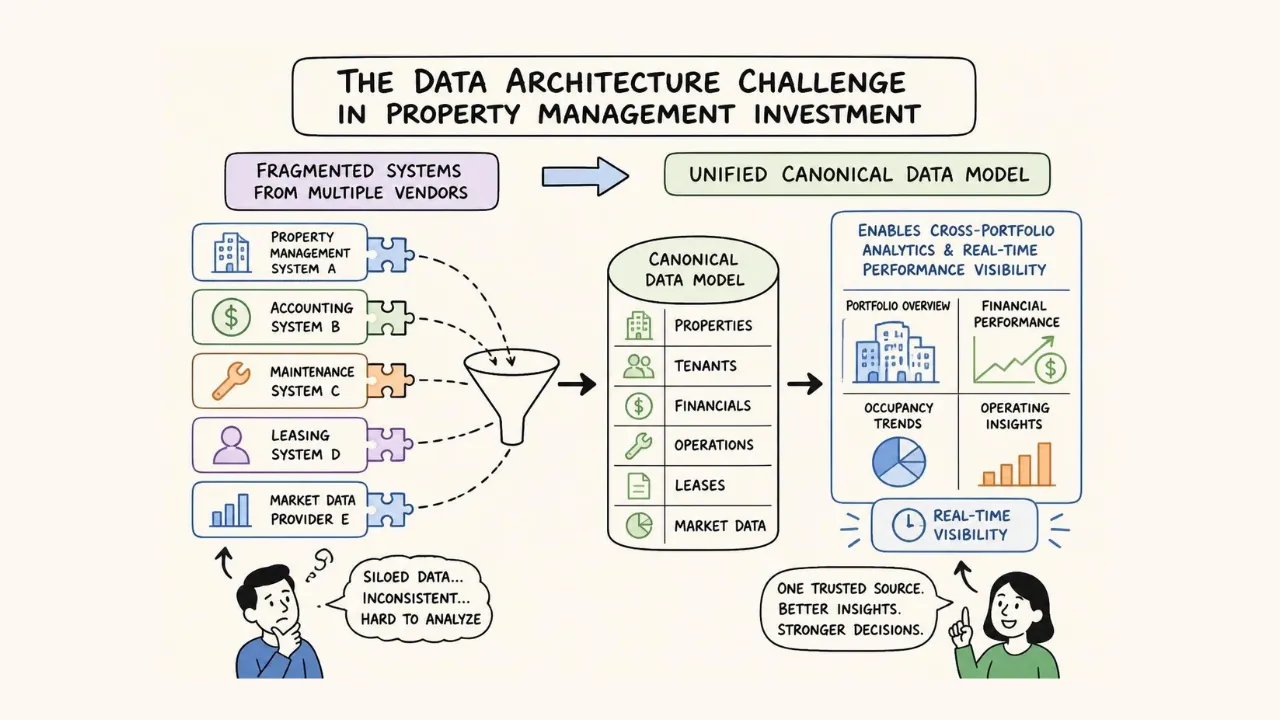
Property management investment has evolved from a purely operational discipline into a sophisticated data challenge that defines competitive advantage for asset managers and general partners. When institutional investors deploy capital into multifamily assets managed by third-party operators, they inherit a hidden complexity that erodes portfolio visibility and decision-making speed. The fundamental issue isn't about choosing better property managers or negotiating reporting frequencies. The problem is structural: a data architecture gap between asset ownership and performance transparency.
The Hidden Cost of Property Management System Fragmentation
Most general partners managing multifamily portfolios accept monthly property manager reports as authoritative sources of truth. This assumption creates a systemic vulnerability that compounds across portfolio scale.
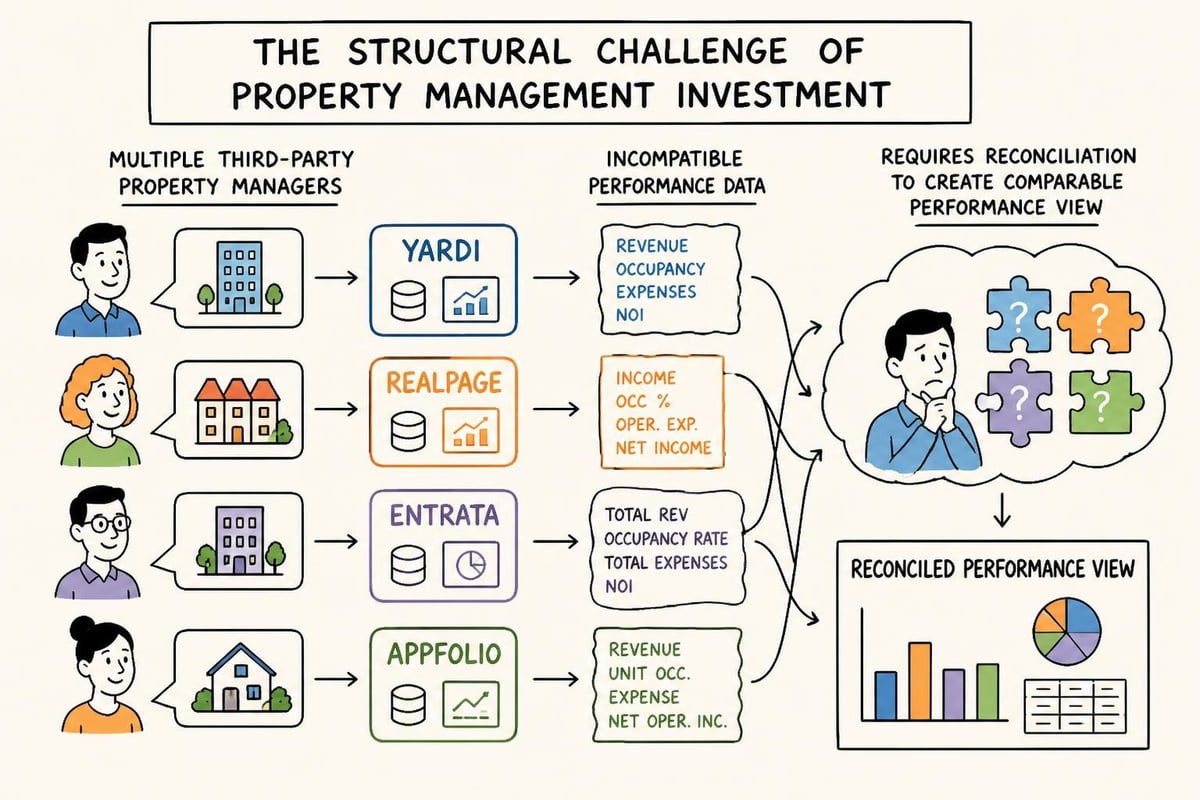
Property management systems like Yardi, RealPage, Entrata, and AppFolio have become the operational backbone of multifamily asset management, yet each platform implements fundamental metrics differently. What one system categorizes as "economic occupancy" another treats as "physical occupancy." Collection rates vary based on when systems recognize payments versus when they apply to ledgers. NOI calculations differ in treatment of concessions, bad debt reserves, and capital expenditure classifications.
The consequences multiply when portfolio diversity increases:
A GP with three managers running three different systems receives three incompatible versions of portfolio performance
Aggregate reporting requires manual reconciliation, often taking 15-20 business days after month-end
Variance analysis becomes impossible when denominators and numerators follow different calculation logic
Investment committee materials rely on stale data that obscures emerging trends
This fragmentation transforms property management investment from a strategic discipline into an archaeological exercise in data interpretation.
Why Traditional Solutions Fall Short
The conventional approach to this challenge involves standardizing reporting templates and requesting custom exports from property managers. This strategy addresses symptoms rather than root causes.
Property managers operate under tight operational constraints. Customizing reports for each investor creates workload that directly conflicts with their core competency of managing physical assets and resident relationships. The result is a perpetual negotiation between what investors need and what operators can reasonably deliver within existing systems.
Standard workarounds and their limitations:
Monthly manager calls: Verbal updates lack granularity and create no audit trail
Quarterly business reviews: Too infrequent to catch operational issues before they impact NOI
Annual audits: Validate historical data but provide zero forward visibility
Custom dashboards: Require manual data entry that introduces human error and delays
Investment professionals find themselves trapped between incomplete real-time visibility and comprehensive delayed reporting. Neither option serves the decision velocity that active real estate investing demands in 2026's competitive market environment.
The Universal Data Model Framework
Solving the property management investment visibility challenge requires rethinking the relationship between property management systems and ownership-side analytics. The answer lies in a canonical data architecture that maps fragmented PMS outputs into standardized objects that enable meaningful cross-manager comparison.
A Universal Data Model establishes fixed definitions for the fundamental building blocks of multifamily operations. Rather than forcing property managers to change their systems, this approach creates a translation layer that normalizes data at ingestion.
Core Canonical Objects in Property Management
The foundation of unified property management investment analytics rests on eight primary object types that capture every material transaction and state change within a multifamily portfolio:
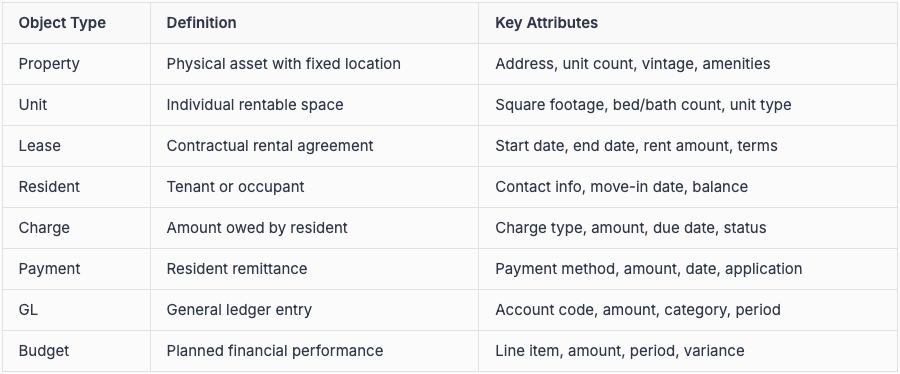
Each object maintains relationships with others through foreign keys that preserve data integrity regardless of source system. A payment links to a charge, which links to a lease, which links to a unit, which links to a property. This relational structure enables queries that traverse the entire data hierarchy.
The work order object extends this foundation to capture operational activity: maintenance requests, vendor assignments, completion status, and cost allocation. Together, these nine objects represent every dimension of property management investment that impacts financial performance.
Mapping Proprietary Systems to Standard Schema
Translation logic forms the technical core of the Universal Data Model approach. Each property management system exports data in proprietary formats with system-specific field names, date formats, and calculation methodologies.
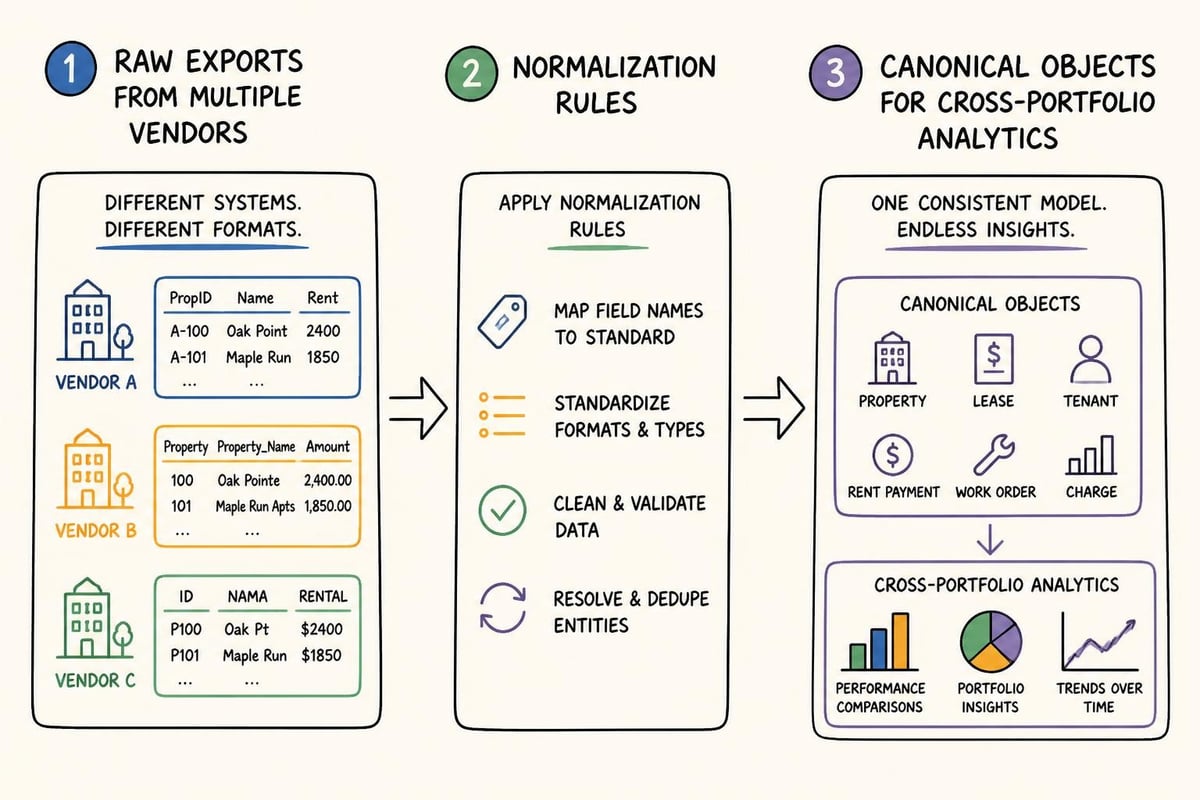
The mapping process follows three sequential transformations:
Ingestion: Raw exports from Yardi, RealPage, Entrata, or AppFolio enter the pipeline in native formats (CSV, XML, API responses)
Normalization: System-specific fields map to canonical object attributes using predefined transformation rules
Validation: Data quality checks verify completeness, flag anomalies, and ensure referential integrity across related objects
Consider how different systems handle the concept of "available units." Yardi might exclude units under renovation from availability, while RealPage includes them if marketing has commenced. The mapping layer enforces a single definition based on the investor's analytical requirements, typically "units legally available to rent and not under active lease."
This standardization enables the comparison that defines modern property management investment strategy: identical metrics calculated identically across the entire portfolio regardless of who manages the property or which software they use.
Building Cross-Manager Analytics Capabilities
Once property management investment data exists in a Universal Data Model, entirely new analytical capabilities emerge that were previously impossible with fragmented reporting.
NOI Variance Reporting Across Managers
Net operating income analysis typically happens at the property level using manager-provided financials. With normalized data, variance analysis can identify performance patterns across the portfolio that individual property reports obscure.
A comprehensive NOI variance report compares:
Actual vs. budget at the portfolio, manager, and property levels
Current period vs. prior period to identify trend acceleration or deceleration
Current manager performance vs. portfolio average to surface outliers
Expense category growth rates to detect cost inflation before it impacts margins
The critical difference from traditional reporting: these comparisons use identical calculation logic applied to identically structured data. A 5% variance at one property means exactly the same thing as a 5% variance at another property, regardless of which property management system generated the underlying transactions.
Investment committees gain the ability to ask previously unanswerable questions: "Which manager consistently delivers NOI closest to budget?" "Do properties managed in Yardi show systematically different expense patterns than properties in RealPage?" "What correlation exists between manager tenure and NOI volatility?"
Real-Time Occupancy Comparison
Physical occupancy and economic occupancy represent distinct metrics that most investors track monthly. The Universal Data Model enables daily or even real-time visibility into occupancy trends by processing unit and lease objects as they update.
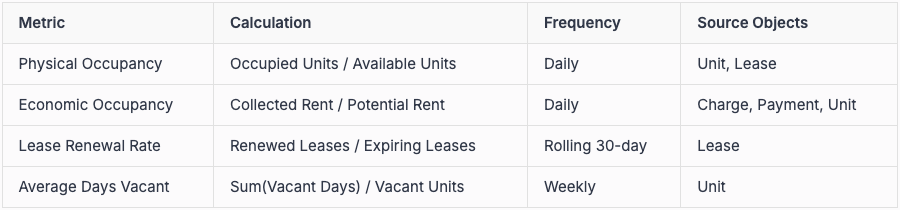
Real-time occupancy tracking reveals leading indicators that monthly reports miss entirely. A property showing stable 95% occupancy at month-end might have experienced a mid-month spike in notice-to-vacates that will impact next quarter's performance. Early visibility enables proactive intervention.
The comparison dimension adds strategic value beyond single-property tracking. Portfolio-wide occupancy trends indicate market conditions affecting all assets. Divergence between properties under different managers suggests operational rather than market factors. These insights require data normalization that the Universal Data Model provides as infrastructure rather than custom analysis.
Budget vs. Actuals Drill-Down
Annual budgets form the foundation of investment underwriting and hold property managers accountable to projected returns. Traditional budget variance analysis happens quarterly or monthly through manager-prepared reports that aggregate expenses into high-level categories.
Granular drill-down capability transforms budget variance from a reporting exercise into an operational diagnostic tool. When a property shows 12% variance to expense budget, the immediate question becomes: which specific line items drive that variance?
The Universal Data Model enables multi-level variance analysis:
Portfolio level: Total actual vs. total budget across all properties
Manager level: Each manager's aggregate performance vs. their combined property budgets
Property level: Individual asset performance vs. pro forma
Category level: Revenue and expense categories (utilities, payroll, marketing, maintenance)
Account level: Specific GL accounts showing largest absolute and percentage variances
Transaction level: Individual charges and payments contributing to account-level variances
This hierarchical drill-down capability connects investment strategy to operational execution. A 200 basis point variance in utilities expense might result from a single HVAC system failure that requires capital expenditure rather than operational inefficiency. The ability to identify root causes in days rather than weeks enables faster decision-making and tighter operational control.
Tools designed for real estate investment analysis increasingly incorporate these drill-down capabilities as table stakes for institutional property management investment.
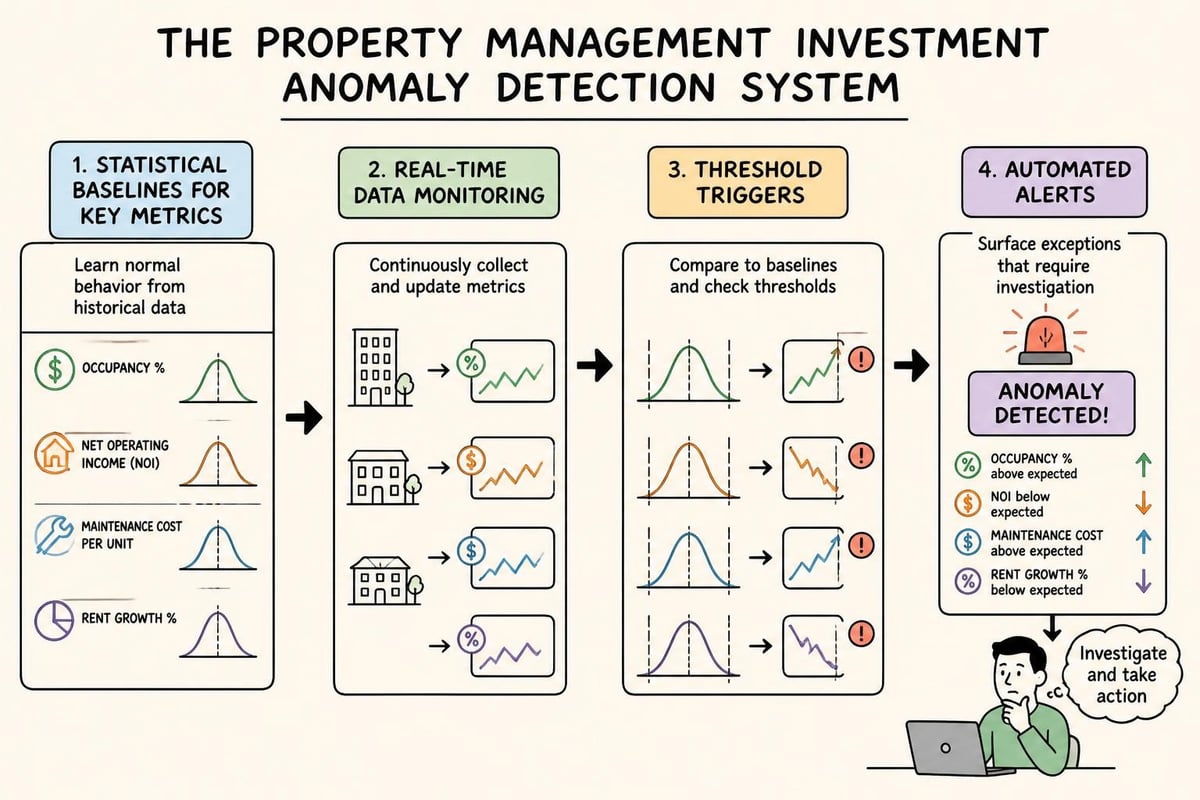
Automated Exception Detection and Anomaly Alerting
The human capacity to monitor dozens or hundreds of properties for emerging issues scales poorly. Automated anomaly detection applies statistical methods to normalized property management data to surface exceptions that warrant investigation.
Statistical Baseline Establishment
Effective anomaly detection requires understanding normal operating ranges for key metrics. The Universal Data Model's historical data enables calculation of rolling baselines that account for seasonality and property-specific characteristics.
Common baseline approaches include:
Moving averages with standard deviation bands for metrics like collection rates and turnover costs
Year-over-year comparisons adjusted for occupancy levels and market rent growth
Cohort analysis grouping similar properties by vintage, location, and unit mix
Manager performance bands establishing expected ranges based on historical delivery
A property showing 88% collections in January might represent normal seasonality or signal deteriorating resident quality. Baseline comparison provides context that absolute numbers cannot. If the property's three-year January average is 91% with standard deviation of 1.5%, then 88% represents a statistically significant outlier requiring investigation.
Trigger-Based Alert Configuration
Property management investment at scale requires selective attention focused on meaningful deviations rather than comprehensive monitoring of every metric. Alert triggers transform the Universal Data Model from passive repository into active surveillance system.
Institutional investors typically configure alerts around four categories of exceptions:
Revenue realization: Collection rates below threshold, bad debt above budget, concession usage exceeding plan
Occupancy events: Notice-to-vacates clustering, renewal rates declining, days-to-lease extending
Expense escalation: Category spending exceeding budget by defined percentage, vendor concentration, recurring maintenance patterns
Operational metrics: Work order completion times, resident satisfaction scores, inspection finding rates
The platform monitors these conditions continuously, triggering notifications only when data crosses defined thresholds. This selective alerting prevents notification fatigue while ensuring material issues surface immediately.
Modern CRE asset management software increasingly emphasizes these proactive monitoring capabilities as essential infrastructure for property management investment discipline. The difference between reactive and predictive portfolio management often reduces to how quickly ownership teams detect and respond to emerging operational issues.
Implementing Data-Driven Property Management Investment
Transitioning from monthly manager packets to continuous portfolio visibility requires technical infrastructure and organizational change management. The implementation path varies by portfolio size, manager relationships, and internal technical capabilities.
Data Integration Architecture
Establishing connections between property management systems and the Universal Data Model follows one of three integration patterns depending on system capabilities and manager cooperation.
API-based integration provides the cleanest solution when property management systems expose modern REST APIs. Yardi Voyager, RealPage OneSite, and Entrata all offer API access, though availability often depends on subscription tier and manager permission. API integration enables near-real-time data synchronization with minimal manual intervention.
Scheduled file exports represent the most common integration pattern. Property managers generate standardized exports (typically CSV format) on defined schedules-daily for transactional data, weekly for operational metrics, monthly for financial statements. Automated ingestion processes retrieve these files from SFTP servers or cloud storage locations and feed them into normalization pipelines.
Manual upload processes serve as fallback for managers using legacy systems or those unwilling to establish automated connections. While labor-intensive, manual uploads still benefit from the Universal Data Model's normalization logic, ensuring consistency even when data arrives through human intervention.
Organizational Workflow Changes
Technology infrastructure enables new capabilities, but realizing value requires adapting investment team workflows to leverage continuous data availability.
Portfolio review cadences typically shift from monthly to weekly or bi-weekly. Rather than waiting for complete manager packets, teams review dashboard updates that aggregate performance across the portfolio. Monthly manager calls transition from status updates to exception discussions focused on anomalies the system has already identified.
Investment committee materials evolve from retrospective summaries to forward-looking analyses. When current-month performance data exists 5-7 days into the following month rather than 20-25 days, IC presentations can address emerging trends before they become historical facts.
Asset management responsibilities expand from relationship management to analytical investigation. Property managers remain responsible for operational execution, but ownership-side teams gain tools to perform independent analysis, validate manager assertions, and identify optimization opportunities without waiting for quarterly business reviews.
The organizational shift mirrors the broader trend toward AI-powered real estate workflows that augment human judgment with data-driven insights.
The Leni Universal Data Model Approach
Leni's platform architecture specifically addresses the data fragmentation challenge that undermines property management investment visibility for institutional asset managers. Rather than building another dashboard that displays whatever data managers provide, Leni functions as the canonical data layer that normalizes inputs from any property management system into analytically consistent objects.
System-Agnostic Data Ingestion
Leni maintains pre-built connectors for the major property management platforms-Yardi Voyager, RealPage OneSite, Entrata, AppFolio, and Rent Manager-plus flexible ingestion for custom formats. Each connector implements system-specific mapping logic that translates proprietary schemas into Leni's Universal Data Model.
When a property managed in Yardi reports a payment, Leni's connector identifies the resident, matches it to the active lease, applies the payment to outstanding charges following the lease's payment priority rules, and updates the general ledger with the corresponding cash receipt entry. The same process executes for RealPage data, but the connector handles RealPage's different field names, date formats, and transaction structures automatically.
The result: ownership teams query a single database using consistent object definitions rather than reconciling multiple manager reports with incompatible schemas. A payment is always a payment with standardized attributes regardless of which PMS originally recorded it.
Pre-Built Analytical Templates
Beyond data normalization, Leni provides purpose-built templates for the analytical outputs that define modern property management investment:
NOI variance reports compare actual performance against budget and prior periods at portfolio, manager, property, and line-item levels. Drill-down capability connects summary variances to specific transactions, enabling rapid root cause identification.
Occupancy comparison dashboards track physical occupancy, economic occupancy, lease expirations, renewals, and new leases across the portfolio with daily granularity. Trend analysis identifies divergence from historical patterns or budget assumptions before monthly reports arrive.
Budget vs. actuals analysis operates at the GL account level, showing which specific expense categories drive variance and how current run-rates project to year-end totals. Forecasting models incorporate actual spend patterns to provide updated projections that adjust for performance drift.
These templates represent institutional knowledge codified into repeatable analytics rather than custom analysis requiring specialized expertise. Investment teams gain enterprise-grade analytical capabilities without building internal data science functions.
Enterprise-Grade Security and Compliance
Property management investment data contains sensitive financial information and personally identifiable resident data requiring institutional security standards. Leni's architecture implements SOC 2 Type II controls, encryption at rest and in transit, role-based access controls, and comprehensive audit logging.
Data isolation ensures that multiple GPs using Leni's platform never interact with each other's information. Each client exists in a logically separated environment with dedicated encryption keys and access credentials. This multi-tenant architecture delivers cloud economics while maintaining the data security that institutional investors require.
Compliance frameworks for GDPR, CCPA, and other privacy regulations govern how Leni handles resident data. Automated data retention policies and deletion workflows ensure that information exists only as long as legally required, reducing compliance risk for asset managers who don't directly manage operations but must ensure their data vendors maintain appropriate protections.
The combination of technical capability and institutional-grade security positions Leni as infrastructure rather than vendor relationship. Just as investors rely on fund administrators for financial record-keeping, property management investment increasingly depends on specialized data platforms that provide the canonical representation of portfolio performance. Understanding the best asset management software options available helps investors make informed infrastructure decisions.
Measuring ROI on Property Management Investment Infrastructure
Implementing a Universal Data Model approach requires upfront investment in integration work, team training, and process adaptation. Quantifying return on this infrastructure spend involves both hard cost savings and value creation through improved decision-making.
Direct Cost Reduction
Analyst time reallocation represents the most immediate measurable benefit. Asset management teams at institutional firms typically employ analysts who spend 40-60% of their time on data collection, reconciliation, and report preparation. Automated ingestion and standardized analytics redeploy this capacity toward higher-value activities like market analysis, manager evaluation, and investment sourcing.
A ten-person asset management team spending 50% of their time on data work represents approximately $1.2-1.8 million in annual fully-loaded compensation. Reducing that proportion to 20% through infrastructure investment yields $720,000-1,080,000 in redeployed analytical capacity annually.
Manager reporting burden decreases when ownership teams can self-serve analytics rather than requesting custom reports. This improvement strengthens manager relationships by reducing operational friction and often translates to fee concessions during contract renewals. Property management fees typically range from 2.5-4% of collected revenue; even modest efficiency gains can justify technology investment.
Strategic Value Creation
The harder-to-quantify but more significant ROI comes from decisions enabled by better information. Early detection of occupancy deterioration enables intervention before revenue loss compounds. Rapid identification of expense creep prevents budget overruns from becoming permanent operating cost increases. Comparative manager analysis supports data-driven retention and replacement decisions.
Portfolio optimization opportunities emerge from cross-property analytics impossible with fragmented data. Identifying which unit types consistently outperform in renewals and rent growth informs capital allocation for value-add improvements. Understanding which amenities correlate with lower turnover drives strategic investment decisions. These insights compound over time as the Universal Data Model accumulates historical performance data that reveals patterns monthly reporting obscures.
For firms managing billions in multifamily assets, marginal improvements in NOI yield dramatic value creation. A 50 basis point improvement in portfolio-wide NOI margin on a $2 billion multifamily portfolio generates $10 million in additional annual income. At typical multifamily cap rates of 5-6%, that income stream represents $160-200 million in incremental asset value.
Future Directions in Property Management Investment Technology
The evolution from monthly manager packets to continuous portfolio visibility represents just the beginning of data-driven transformation in property management investment. Several emerging capabilities will further reshape how institutional investors interact with their multifamily holdings.
Predictive Analytics and Machine Learning
Historical performance data in standardized formats enables predictive modeling that forecasts future outcomes based on leading indicators. Machine learning models trained on Universal Data Model objects can predict lease renewal probability based on payment history, maintenance request patterns, and resident tenure. Occupancy forecasting improves by incorporating seasonality, local employment trends, and property-specific marketing effectiveness.
These predictive capabilities transform reactive portfolio management into proactive optimization. Rather than responding to declining occupancy after it appears in monthly reports, investment teams receive probability-weighted forecasts that enable intervention before decline materializes.
Automated Benchmarking and Market Intelligence
Property management investment decisions improve when performance context extends beyond internal portfolio comparison. Integrating third-party market data-rent comps, demographic trends, supply pipelines-with property-level operational data enables sophisticated market positioning analysis.
Automated benchmarking compares portfolio properties against market competitors on rent per square foot, occupancy rates, tenant retention, and operating expense ratios. This external context distinguishes properties underperforming due to market conditions from those suffering operational deficiencies requiring manager intervention.
Platforms like Leni that combine proprietary portfolio data with commercial real estate databases provide the comprehensive visibility that sophisticated property management investment strategies require. The integration of internal operations with external market intelligence creates decision support systems that augment institutional investment expertise with data-driven precision.
Property management investment success in 2026 depends on solving the data architecture challenge that separates asset ownership from operational visibility. The Universal Data Model approach transforms fragmented manager reports into unified analytics that enable cross-portfolio comparison, real-time monitoring, and proactive exception management. For institutional investors managing multifamily portfolios across multiple third-party operators, this infrastructure shift from monthly packets to continuous visibility represents competitive advantage in an increasingly data-driven industry. Leni provides the purpose-built platform that enterprise investment teams need to implement this capability at scale, combining proven integrations with major property management systems, institutional-grade security, and pre-built analytical templates designed specifically for ownership-side workflows.

Johanna Gruber
Johanna has spent the last 8 years helping marketing teams connect with audiences through content. Specializing in B2B SaaS and real estate.
Curious About AI?
Join the largest AI community for real estate online. Get bite-sized, real-world use case videos, plus practical tips and proven strategies from top industry experts on adopting AI effectively.
MEET LENI
AI SuperAgent Purpose Built for Investors and Operators.
Experience how professionals and teams in your domain are getting the edge using AI.