Tools for Data Analysis: 7 Categories for Investment Pros
Tools for Data Analysis: 7 Categories for Investment Pros
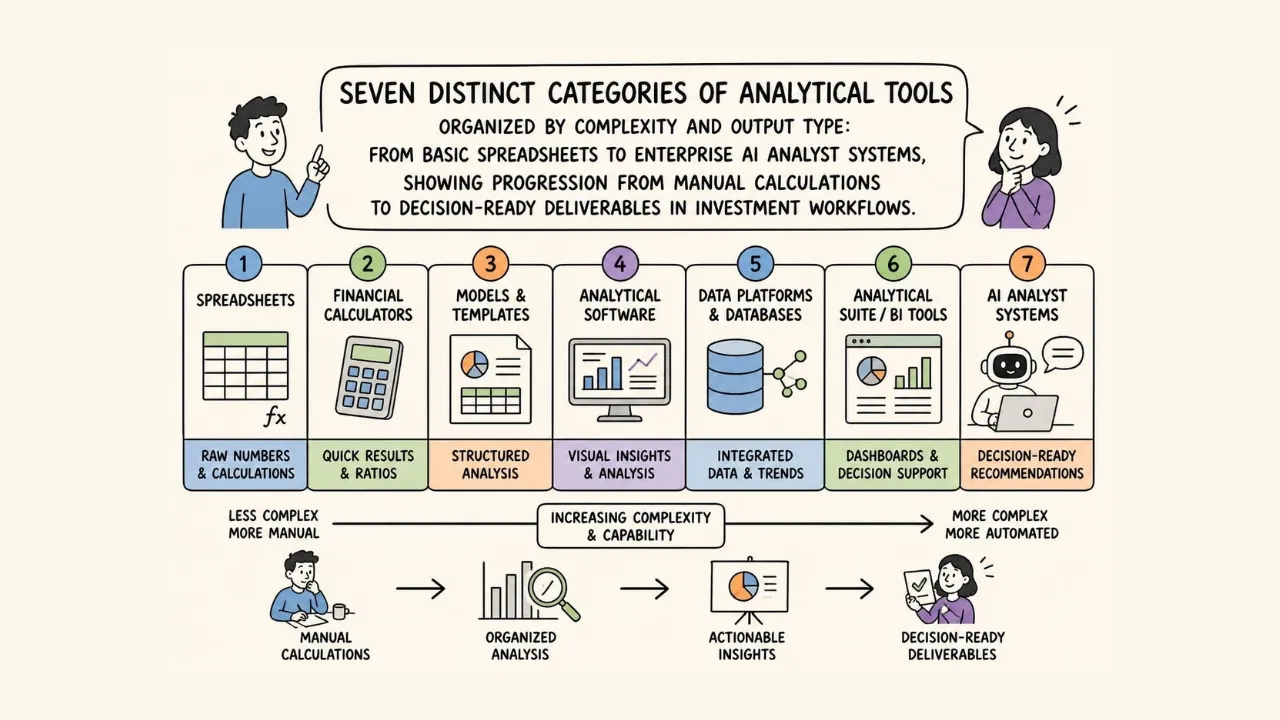
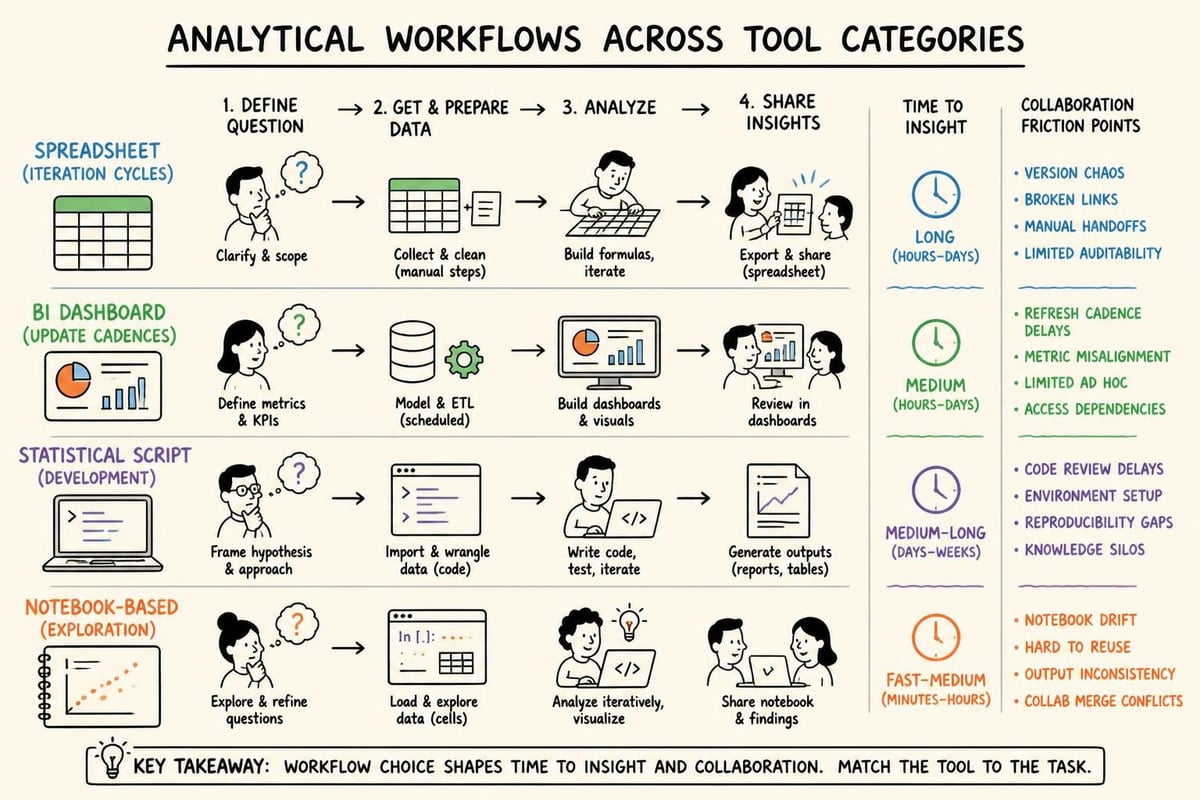
The investment landscape demands precision, speed, and confidence in every analytical output. Whether you're underwriting a commercial real estate portfolio, modeling cash flows across multi-family assets, or synthesizing market research for LP reports, the tools for data analysis you choose directly impact the quality and defensibility of your work. Yet the marketplace has fragmented into dozens of categories, each promising to solve different parts of the analytical workflow. This guide organizes the landscape into seven practical categories, comparing them by use case, data complexity, collaboration requirements, governance capabilities, and most importantly, how close each gets you to a decision-ready deliverable that your team can trust and act upon.
1. Spreadsheets: The Foundation Layer for Manual Analysis
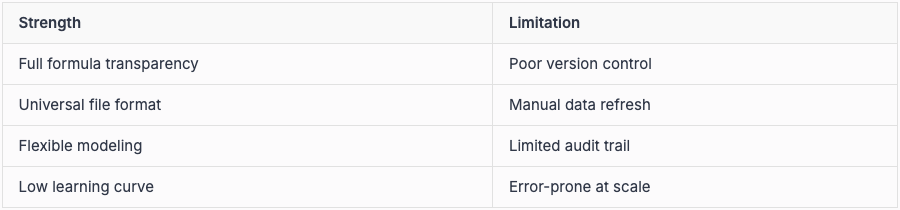
Spreadsheets remain the backbone of financial analysis because they offer complete transparency and control over every calculation. Excel, Google Sheets, and similar platforms give analysts full visibility into formulas, assumptions, and data transformations.
When Spreadsheets Excel
Investment professionals rely on spreadsheets for:
Cash flow modeling where every assumption needs documentation
Sensitivity tables that show how variables interact
Quick ad-hoc calculations during live meetings
Template-based underwriting with standardized formats
The hands-on nature of spreadsheet work creates deep understanding. When you build a discounted cash flow model cell by cell, you internalize the relationships between rent growth, vacancy assumptions, and terminal cap rates in ways that black-box tools cannot replicate.
The Scalability Wall
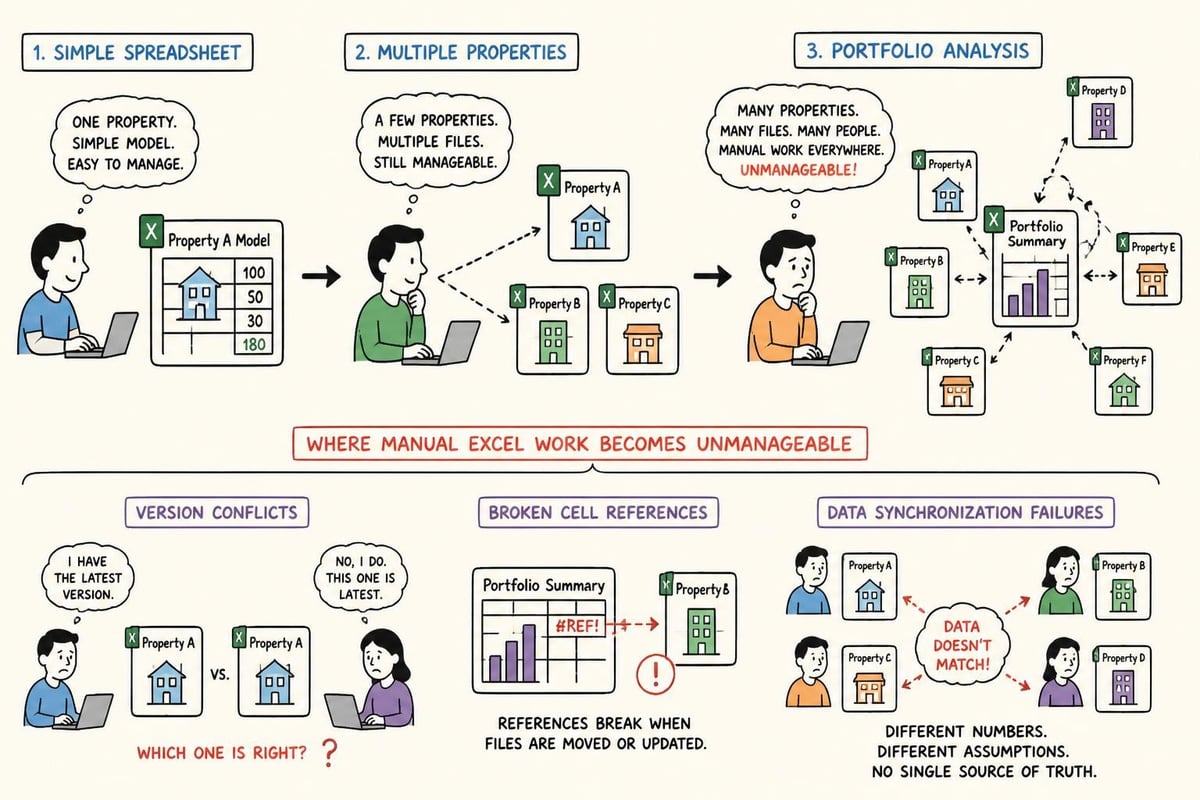
Spreadsheets break down when analysis becomes collaborative or repetitive. Version control nightmares emerge when five team members email revised Excel files back and forth. Error rates climb as models grow beyond a few hundred rows. Data analysis tools have evolved specifically to address these limitations, but spreadsheets still serve as the common language of finance.
For commercial real estate professionals working with property-level data, spreadsheets handle individual asset analysis well but struggle when portfolio views require aggregating hundreds of properties with different holding periods, partnership structures, and reporting requirements.
2. Business Intelligence Dashboards: Visualization for Stakeholder Communication
BI platforms like Tableau, Power BI, and Looker transform raw data into interactive visualizations that communicate patterns and trends to non-technical audiences. These best data visualization tools prioritize presentation over analysis depth.
The Dashboard Advantage
BI tools serve specific communication needs:
Board presentations requiring visual impact
KPI monitoring with automated refresh schedules
Drill-down capabilities for exploring dimensions
Cross-functional sharing with role-based access
Investment committees appreciate dashboards that show portfolio performance, concentration risk, and market positioning at a glance. The visual layer helps diverse stakeholders absorb complex information without diving into underlying data structures.
The Analysis Gap
Dashboards display what happened, but rarely explain why or model what comes next. They require separate data preparation, often through ETL pipelines or data warehouses. The analyst still performs calculations elsewhere, then feeds results to the visualization layer.
BI platforms work best when paired with upstream analytical systems. A private equity fund might use Power BI to display portfolio IRR and cash-on-cash returns, but those metrics originate from models built in other environments. The dashboard becomes the last mile of communication, not the analytical engine itself.
Key considerations for investment teams:
Data refresh frequency and reliability
Security controls for sensitive portfolio information
Mobile access for traveling investment professionals
Integration costs with existing data sources
3. Relational Databases: Structure for Complex Data Relationships
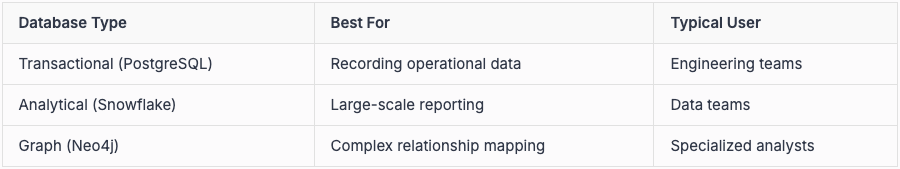
PostgreSQL, MySQL, and enterprise data warehouses like Snowflake provide the structural foundation for managing interconnected investment data. These systems excel when relationships between entities matter as much as the data itself.
When Databases Become Critical
Investment operations demand relational structures for:
Property-tenant-lease hierarchies in CRE portfolios
Fund-investor-capital call tracking across vintage years
Transaction history with full audit trails
Reference data consistency across reporting periods
A commercial real estate database must track properties, units, leases, tenants, guarantors, vendors, and capital events while maintaining referential integrity. When a tenant moves from one unit to another, properly structured databases update all dependent records automatically.
The Analyst Barrier
Database systems require SQL knowledge and careful schema design. Most investment professionals lack the technical background to query databases directly, creating dependency on data teams or BI layers that translate between database structures and business questions.
Organizations often implement databases to solve data quality and consistency problems, then discover they've created a new bottleneck where analysts must request data extracts rather than exploring freely. The governance benefits come at the cost of analytical agility.
For firms exploring AI tools for financial modeling, the database layer determines what information AI systems can access and how quickly they can retrieve context across historical transactions, market data, and property attributes.
4. Statistical Computing Environments: Depth for Quantitative Analysis
R, Python with pandas, and MATLAB provide programmatic environments for statistical analysis, econometric modeling, and quantitative research. These tools for data analysis offer unlimited analytical flexibility for professionals with coding skills.
Statistical Platform Strengths
Quantitative investment teams leverage statistical environments for:
Custom econometric models with specific assumptions
Monte Carlo simulations across thousands of scenarios
Portfolio optimization algorithms
Time series forecasting with advanced techniques
The best data analytics tools in this category support reproducible research through script-based workflows. An analyst can document every data transformation and model specification, enabling peer review and regulatory audit.
The Specialization Tradeoff
Statistical platforms require programming expertise that most investment professionals don't possess. Even talented analysts face steep learning curves mastering libraries, debugging code, and managing computational environments. A pricing model that takes thirty minutes to code might require hours of troubleshooting when edge cases emerge.
These tools serve research functions and quant teams but rarely integrate into day-to-day investment operations. The outputs still require translation into Excel or presentation formats that deal teams and investment committees can consume and validate.
Common applications in investment contexts:
Regression analysis for rent growth forecasting
Risk factor decomposition across portfolio holdings
Market cycle identification using time series analysis
Custom attribution models for performance measurement
5. Data Science Notebooks: Collaborative Exploration with Code
Jupyter, Observable, and Google Colab combine code execution, visualization, and documentation in interactive notebooks. These platforms bridge statistical computing and collaborative analysis, particularly for teams that want to share methodology alongside results.
Notebook Innovation
Data science notebooks enable:
Inline visualizations that update as data changes
Narrative documentation explaining analytical choices
Shared workspaces where teams iterate together
Reproducible workflows from raw data to conclusions
Investment research teams use notebooks to document due diligence processes, showing stakeholders not just the conclusion but the full analytical journey. When reviewing a real estate acquisition, the notebook might include property data imports, comparable sales analysis, cash flow projections, and sensitivity testing all in one shareable artifact.
The Production Challenge
Notebooks excel at exploration but struggle in production environments. They work well for one-time analyses and research documentation but become fragile when repurposed as recurring reporting systems. Version control remains awkward, and non-technical stakeholders rarely interact with notebook interfaces directly.
The gap between exploratory notebook analysis and decision-ready deliverables remains substantial. Outputs still require reformatting for investment memos, board decks, and client reports. For firms managing portfolio strategy across multiple fund vehicles, the translation overhead multiplies with each additional audience.
6. General-Purpose AI Chatbots: Conversational Access with Generic Context
AI chatbots provide natural language interfaces to analytical capabilities, lowering technical barriers for non-technical users. These systems answer questions, generate code, and explain concepts through conversation rather than requiring knowledge of specific syntax or platforms.
The Accessibility Promise
General AI chatbots democratize access to analytical capabilities by:
Translating business questions into technical operations
Generating Python or SQL code from plain English requests
Explaining statistical concepts in accessible language
Providing starting points for analytical workflows
An investment professional might ask "What's the average rent growth in Sunbelt markets over the past five years?" and receive working code to analyze available data, along with caveats about data quality and methodology assumptions.
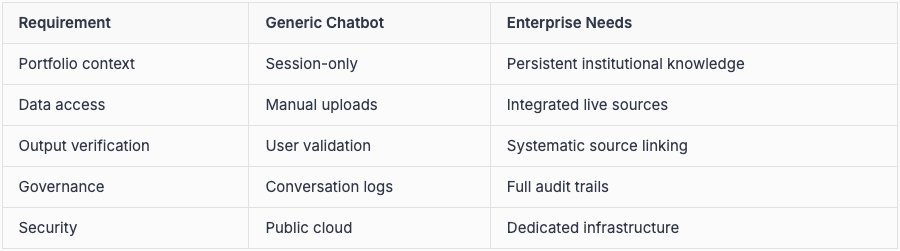
The Enterprise Reality Check
Generic chatbots lack three critical capabilities for serious investment work:
First, context awareness. They don't understand your firm's specific portfolio, investment thesis, or analytical standards. Every conversation starts from zero, requiring extensive prompting to align with organizational context.
Second, data connectivity. Chatbots can't directly access your property management systems, fund accounting data, or market research subscriptions. Users must manually upload or paste information, creating version control risks and limiting analysis to small datasets.
Third, verification and governance. Outputs lack source attribution, audit trails, or systematic accuracy checks. When a chatbot generates a cash flow forecast, validating its assumptions and calculations requires as much work as building the model manually. For regulated investment activities, this verification gap disqualifies chatbot outputs from decision-making processes.
Investment teams exploring real estate AI tools quickly discover that accessibility without accuracy creates liability rather than value.
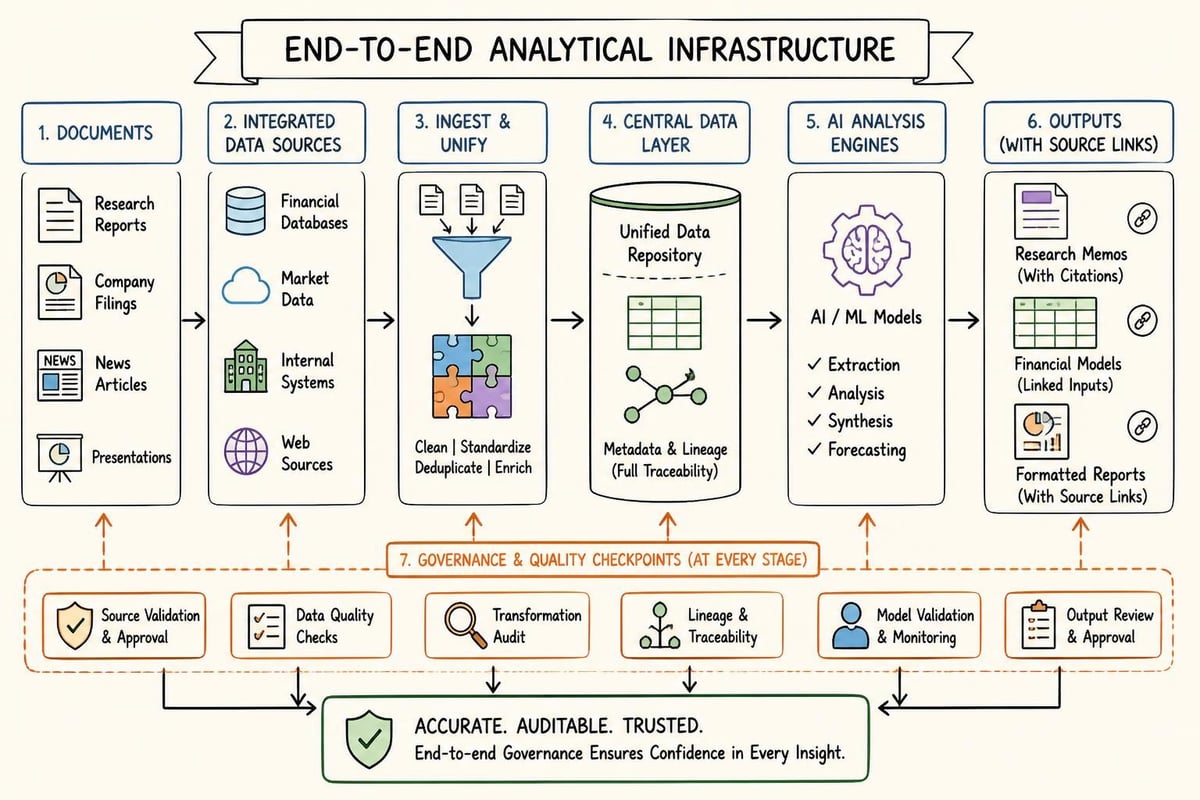
7. Purpose-Built AI Analyst Systems: Infrastructure for Decision-Ready Intelligence
The newest category of tools for data analysis combines AI capabilities with enterprise infrastructure, delivering source-linked research, models, and reports rather than just conversation. These platforms understand that investment professionals need finished deliverables, not prompts and responses.
The Analyst System Architecture
Purpose-built platforms provide:
Document intelligence that extracts and synthesizes information from contracts, offering memoranda, and market reports
Integrated data access connecting property databases, financial systems, and market data providers
Source attribution linking every output claim back to specific documents or data points
Workflow integration fitting into existing investment processes rather than creating parallel systems
Governance frameworks with permissions, audit trails, and security controls
These systems serve two distinct segments. Subscription professionals upload files and receive finished analytical work, research summaries, and formatted outputs without requiring data integrations. Enterprise teams need connected infrastructure where the platform accesses centralized data, respects organizational permissions, maintains full auditability, and supports governance requirements that regulated investment firms demand.
Leni fits into this purpose-built AI analyst category for commercial real estate and investment teams. It is designed to turn documents, financial data, market research, and portfolio information into source-linked outputs such as underwriting support, investment memos, market summaries, and recurring reports.
The Accuracy-First Difference
Generic AI optimizes for helpfulness and engagement. Purpose-built analyst systems optimize for accuracy and verifiability because wrong answers in investment contexts destroy capital and careers. Secure AI for investment firms requires systematic verification, not just confident-sounding responses.
Critical differentiators for enterprise deployment:
Source linking showing exactly where each data point originated
Model flexibility supporting firm-specific underwriting standards
Recurring workflows for portfolio monitoring and investor reporting
Integration depth with property management, accounting, and market data systems
Security architecture meeting institutional requirements
For commercial real estate teams managing portfolio and investment management responsibilities, the platform becomes analytical infrastructure rather than an isolated tool. Market research gets synthesized into investment memos with proper citations. Portfolio monitoring generates formatted reports on schedule. Due diligence materials get processed into structured comp sets and risk assessments.
Enterprise Integration Reality
The seven best data analysis tools typically focus on technical capabilities, but investment teams care equally about change management and adoption. Systems that require analysts to learn new interfaces or re-key data face resistance and failure. Purpose-built platforms succeed when they eliminate work rather than adding new tools to learn.
Organizations implementing these systems typically start with high-value, time-intensive workflows. A private equity real estate fund might begin with portfolio company research, where analysts spend hours reading earnings calls, market reports, and competitor filings. The AI analyst system consumes those documents and produces executive summaries, competitive positioning analysis, and market trend synthesis with full source attribution.
For teams evaluating AI tools for investment analysis, platforms like Leni show where the category is heading: away from generic chat interfaces and toward governed, source-linked analytical workflows that produce decision-ready work.
Modern investment professionals need tools that match the complexity and governance requirements of their work, not generic solutions built for different contexts. The right tools for data analysis depend entirely on your specific workflow, from quick spreadsheet calculations to enterprise-wide analytical infrastructure that transforms documents and data into decision-ready intelligence. Leni provides purpose-built, accuracy-first analytical infrastructure specifically designed for commercial real estate and investment management teams who require source-linked outputs, integrated data access, and governance frameworks that meet institutional standards. Whether you're a subscription professional uploading deal files or an enterprise team connecting centralized data sources, Leni delivers finished analytical work rather than just conversation.

Johanna Gruber
Johanna has spent the last 8 years helping marketing teams connect with audiences through content. Specializing in B2B SaaS and real estate.
Curious About AI?
Join the largest AI community for real estate online. Get bite-sized, real-world use case videos, plus practical tips and proven strategies from top industry experts on adopting AI effectively.
MEET LENI
AI SuperAgent Purpose Built for Investors and Operators.
Experience how professionals and teams in your domain are getting the edge using AI.