


In commercial real estate, traditional reporting cycles often slow decision-making, forcing asset managers to spend countless hours reconciling financials, building spreadsheets, and formatting presentations. This manual effort creates delays between market developments and actionable insights.
Automated real estate reporting revolutionizes this process by directly integrating with data sources, calculating metrics on schedule, and generating ready-to-use reports.
For multifamily operators overseeing portfolios of varying sizes, this transition transforms how teams allocate time, respond to performance trends, and make data-driven decisions with greater speed and accuracy.
Understanding Automated Real Estate Reporting Systems
Automated real estate reporting refers to software systems that extract data from source platforms, perform calculations, and generate formatted reports without human intervention at each step. These systems typically integrate with property management systems, accounting software, and market data providers to access occupancy rates, rent rolls, expense details, and comparable market information. The automation layer applies business logic to raw data, calculating metrics like net operating income, expense ratios, and variance analyses according to predefined rules.
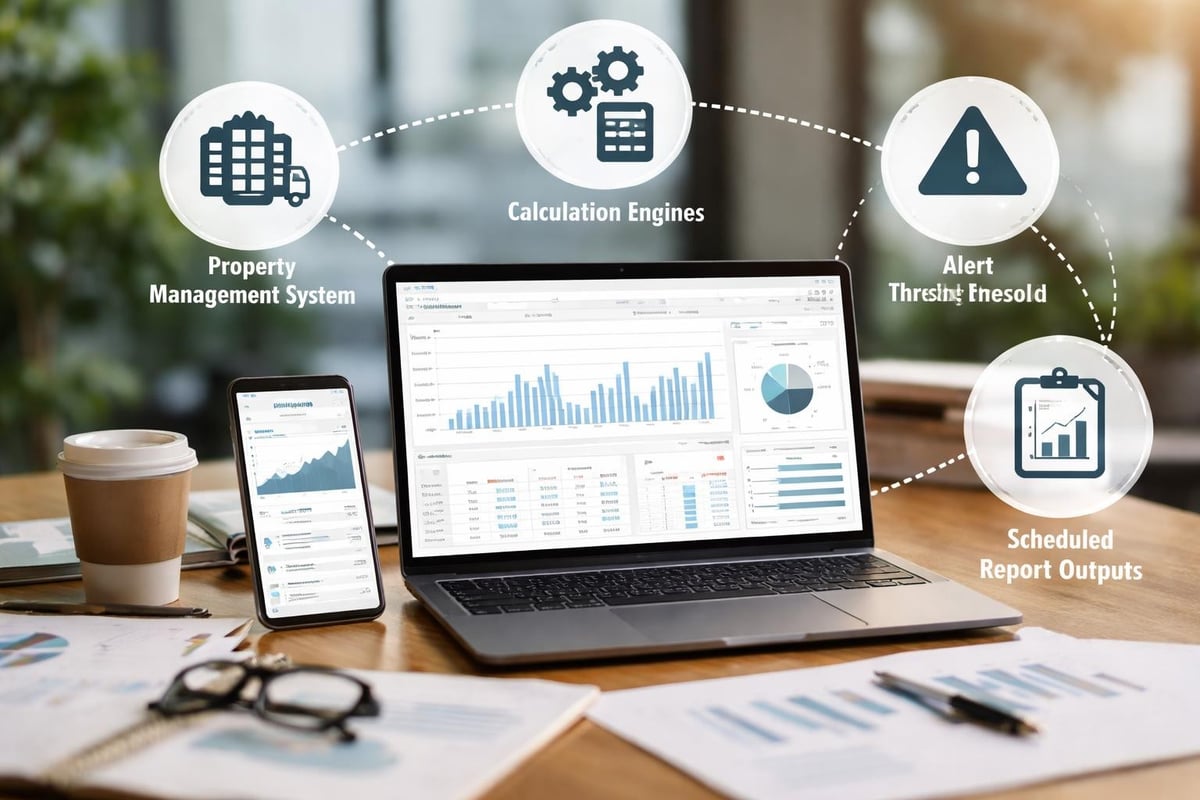
The core components of effective automated reporting include:
- Direct data integration with property management systems and accounting platforms
- Calculation engines that apply consistent formulas across properties and time periods
- Scheduling capabilities for regular report generation and distribution
- Alert mechanisms that notify teams when metrics cross defined thresholds
- Output formatting that produces investor-ready documents and internal dashboards
Commercial real estate teams evaluate these systems based on their ability to reduce manual work while maintaining accuracy. The question is not whether automation can produce reports, but whether it can produce reports that match or exceed the quality of manually prepared documents while citing verifiable sources for each data point.
Data Sources and Integration Points
Property management systems serve as the primary data source for automated real estate reporting. Platforms like Yardi, RealPage, and Entrata house lease details, tenant payments, maintenance records, and operating expenses. Effective automation requires programmatic access to this data through APIs or scheduled data exports. Direct integration with property management systems allows reporting systems to pull updated information on defined intervals without manual file transfers or data entry.
Beyond property-level operations data, automated reporting systems often incorporate:
- General ledger systems for financial reconciliation and capital expenditure tracking
- Market intelligence platforms providing competitive rent data and absorption trends
- Loan servicing platforms tracking debt service, covenants, and cash management
- Capital planning tools monitoring renovation budgets and construction timelines
The integration architecture determines how quickly reports reflect current conditions. Systems that query data sources in real time provide up-to-the-hour accuracy, while those relying on nightly batch processes introduce a one-day lag. For portfolio reviews and investor reporting, daily updates typically suffice. For operational decisions during lease-up or in volatile expense environments, real-time data access becomes more valuable.
Building Effective Reporting Workflows
Automated real estate reporting workflows begin with defining which metrics matter for specific stakeholder groups. Asset managers require different views than regional operations teams or equity partners. A well-designed system accommodates these varying needs through configurable report templates rather than forcing all users into a single dashboard format.
Metric Selection and Calculation Rules
The foundation of any reporting system is the set of metrics it calculates. For multifamily portfolios, standard metrics include:
| Metric Category | Key Calculations | Data Sources Required |
|---|---|---|
| Revenue Performance | Effective rent, rent growth, concession cost | Lease data, market comps |
| Operating Efficiency | Expense ratio, turnover costs, maintenance per unit | GL data, work orders |
| Financial Returns | NOI, cash-on-cash return, IRR | Income statements, capital accounts |
| Occupancy & Leasing | Physical occupancy, economic occupancy, exposure | Lease schedules, rent rolls |
Each metric requires specific calculation rules. NOI calculation seems straightforward, but teams must define whether to include or exclude certain line items, how to treat capital expenditures that straddle operating and improvement categories, and whether to adjust for one-time events. Automated systems encode these decisions into consistent formulas applied across the portfolio. This consistency enables meaningful comparison between properties and across time periods.
Advanced AI-driven portfolio management platforms apply these calculations automatically while maintaining transparency about the methodology. When a metric changes unexpectedly, operators need to understand which underlying data points drove the shift. Systems that show their work, citing specific transactions or line items, build confidence that automation is enhancing rather than obscuring the analytical process.
Scheduling and Distribution Mechanisms
Automated real estate reporting delivers value through regular, predictable output generation. Most commercial real estate organizations operate on monthly reporting cycles aligned with accounting close processes. Automated systems can generate preliminary reports mid-month based on partial data, then update with finalized numbers once the books close. This staged approach gives teams early visibility into performance trends without waiting for complete accounting reconciliation.
Distribution automation ensures reports reach the right stakeholders on schedule. Configuration options include:
- Email delivery to predefined recipient lists with role-based report variations
- Portal access where users log in to view current reports and historical archives
- API endpoints that feed data into business intelligence tools or investor portals
- Mobile notifications alerting key personnel to new report availability
The scheduling granularity matters. Weekly reports on leasing activity help operations teams respond to market shifts, while quarterly financial packages serve board-level review. Systems that support multiple cadences without requiring separate manual processes enable teams to maintain different rhythms for different purposes. Platforms like those specializing in real estate investor software recognize these varying needs and build flexible scheduling into their core functionality.
Proactive Alerts and Exception Reporting
Static reports, even when automated, require someone to review them and identify noteworthy changes. Proactive alert systems flip this model by monitoring metrics continuously and notifying teams only when values cross defined thresholds. This exception-based approach directs attention to properties or metrics requiring immediate action rather than forcing routine review of routine performance.
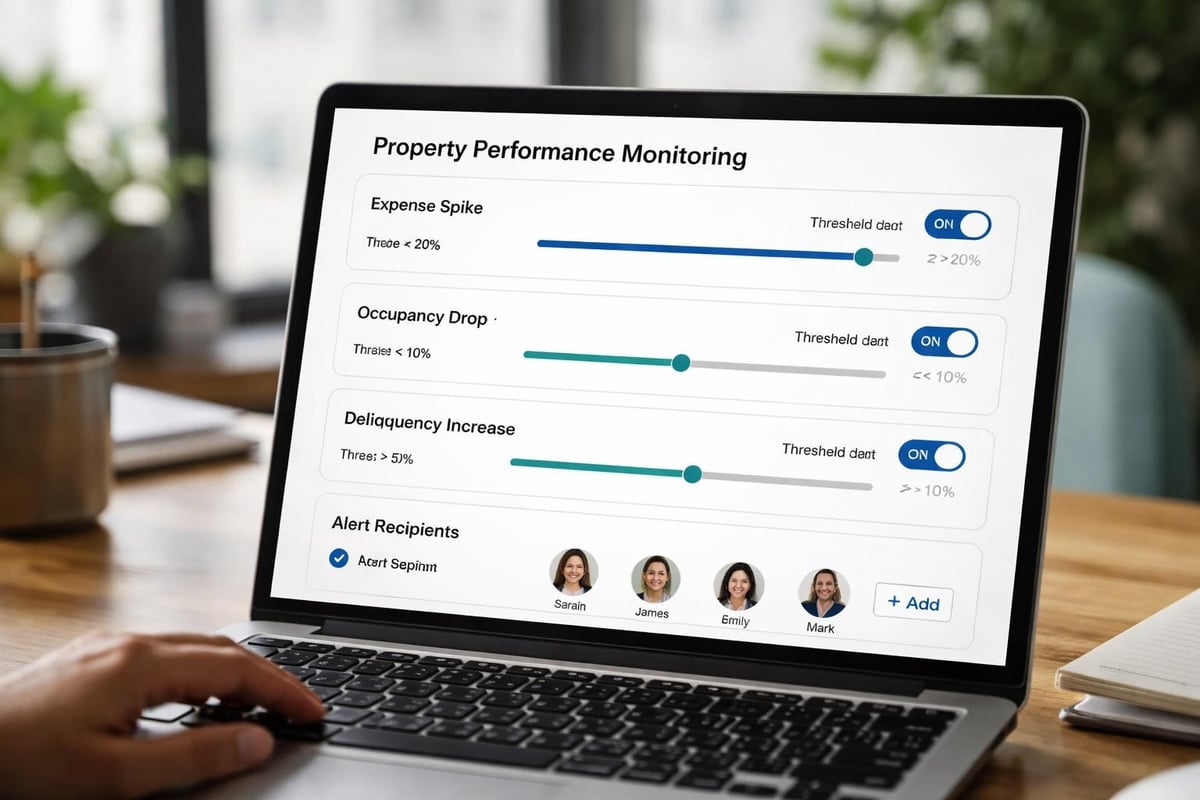
Threshold Configuration and Alert Logic
Effective alert systems allow granular threshold definition at multiple levels. A portfolio-wide alert might trigger when same-store NOI drops below budgeted figures by more than five percent. Property-level alerts could activate when individual properties experience occupancy declines exceeding two percentage points in a single month or when maintenance expenses spike above trailing twelve-month averages.
The logic governing alerts must balance sensitivity with practical utility. Overly sensitive thresholds generate alert fatigue, training teams to ignore notifications. Thresholds set too conservatively miss emerging issues until they become significant problems. Successful implementation typically involves:
- Establishing baseline thresholds based on historical volatility and operational norms
- Testing alert frequency over a trial period to calibrate sensitivity
- Adjusting thresholds by property type, market, or lifecycle stage
- Routing alerts to team members positioned to take corrective action
Expense monitoring provides a practical example. Operating expenses fluctuate seasonally and respond to weather events, capital projects, and turnover rates. A simple threshold comparing current month expenses to budget will generate false positives during known seasonal peaks. More sophisticated logic compares current performance to the same period in prior years, adjusts for known one-time events, and triggers alerts only when variance exceeds expected ranges given historical patterns.
Integration with Operational Workflows
Alerts become actionable when integrated into existing communication and task management systems. Receiving an email notification about a variance is useful. Receiving that same alert in a team Slack channel with context about which property, which expense category, and how the variance compares to peer properties enables immediate collaborative response. The most effective automated reporting systems connect alerts to operational workflows rather than creating separate notification streams that teams must monitor independently.
Consider a scenario where property-level delinquency crosses a threshold. An integrated system might:
- Generate an alert showing the specific properties and tenant accounts driving the increase
- Compare current delinquency to historical norms for that property and portfolio averages
- Provide direct links to the relevant tenant records in the property management system
- Create a task in the operations team’s workflow system for follow-up collection activity
This integration transforms a data point into an action item without requiring manual research or context gathering. Platforms specializing in AI for portfolio management build these connections natively, recognizing that analytical insight only matters when it drives operational response.
Ensuring Data Accuracy and Auditability
Automated systems process large volumes of data quickly, but speed without accuracy creates compliance risk and erodes stakeholder trust. The commercial real estate industry involves significant capital, regulatory oversight, and fiduciary responsibility. Automated real estate reporting must therefore include mechanisms for validation, error detection, and audit trail maintenance.
Source Attribution and Verification
A critical feature separating sophisticated automated reporting from simple dashboard tools is the ability to trace any reported figure back to its source data. When an investor questions a reported variance or an asset manager needs to understand why NOI changed, the system should provide clear attribution showing which transactions, adjustments, or data inputs contributed to the calculated result.
This verification capability requires:
- Transaction-level detail accessible from summary metrics through drill-down functionality
- Source system references indicating which data originated from the PMS versus accounting system
- Calculation transparency showing the formula applied and intermediate steps
- Change logs documenting when data was refreshed and which values updated
Modern approaches to real estate data platforms emphasize this traceability as a core requirement rather than an optional feature. The integration of AI in real estate valuation and reporting demands even greater attention to explainability, as stakeholders need confidence that automated calculations reflect accurate data processing rather than opaque algorithmic outputs.
Quality Controls and Validation Rules
Automated systems should incorporate validation rules that flag potential data quality issues before they propagate into distributed reports. These controls operate at multiple stages:
| Validation Stage | Check Type | Example Rule |
|---|---|---|
| Data Import | Completeness | All expected properties included in feed |
| Data Import | Range Validation | Occupancy values between 0-100% |
| Calculation | Logic Checks | Revenue minus expenses equals NOI |
| Pre-Distribution | Variance Alerts | Month-over-month change exceeds 15% |
When validation rules detect anomalies, the system should pause report distribution and alert designated team members to review the flagged items. This prevents the distribution of reports containing obvious errors while maintaining the automation workflow for clean data. The use of multimodal AI in construction reporting demonstrates how advanced validation can incorporate multiple data types and sources to improve accuracy detection.
Some teams worry that automation reduces their control over outputs. Properly implemented systems actually increase control by making validation rules explicit and consistently applied rather than dependent on individual analyst judgment. The key is building systems that flag exceptions for human review rather than attempting fully autonomous decision-making in areas requiring professional judgment.
Customization for Organizational Structure
Commercial real estate organizations vary in how they structure portfolios, define regions, allocate responsibilities, and measure performance. Automated real estate reporting must accommodate this organizational diversity rather than imposing a rigid structure. The ability to configure hierarchies, group properties by custom attributes, and calculate metrics according to firm-specific definitions determines whether a system supports or constrains operational reality.
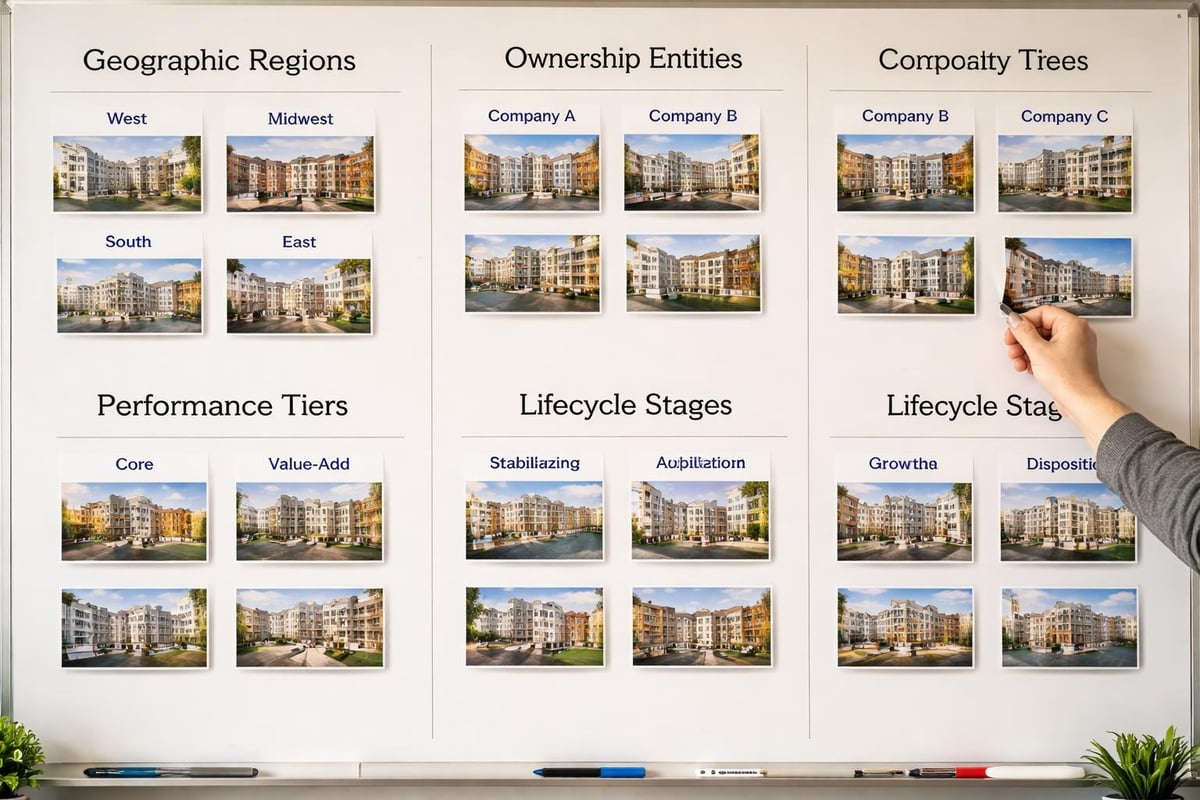
Hierarchy and Segmentation Options
A real estate portfolio can be viewed through multiple organizational lenses simultaneously. The same properties might be grouped by:
- Geographic region for operations management
- Vintage or lifecycle stage for capital planning
- Ownership entity for financial and tax reporting
- Performance tier for strategic resource allocation
Flexible reporting systems allow users to pivot between these views without rebuilding reports manually. A regional director views performance by market, while the CFO needs entity-level financial statements and the CEO tracks performance tiers. Automated systems that support multiple concurrent hierarchies serve all these needs from a single data model.
Custom property attributes enable more nuanced segmentation. Teams might flag properties under renovation, those in lease-up, or assets held for near-term disposition. Reporting filtered or segmented by these custom tags provides more relevant analytical views than generic property lists. The most capable platforms, including specialized real estate dashboards, allow users to define these attributes and build them into standard reports without requiring IT support or system customization.
Metric Definition Flexibility
Different organizations calculate seemingly standard metrics in varied ways. One firm’s definition of economic occupancy might include model units while another excludes them. Lease renewal rates might count renewals as a percentage of expirations, expiring square footage, or total units. Automated reporting that forces standardized calculations creates conflict with existing analytical frameworks and investor reporting commitments.
Configurable metric definitions allow teams to encode their specific business rules into the automation layer. This includes:
- Defining which revenue and expense categories contribute to NOI calculations
- Specifying how to treat partial-month data in occupancy calculations
- Establishing renewal rate numerators and denominators aligned with investor reporting
- Setting expense categorization rules for variance analysis
When implemented thoughtfully, this flexibility maintains the consistency automation provides while respecting the legitimate variation in how different organizations measure performance. Teams adopting new reporting systems should not have to change their metric definitions to match the software. Instead, systems should adapt to encode existing organizational standards.
Integration with Strategic Decision-Making
Automated real estate reporting serves operational monitoring, but its greatest value emerges when analytical outputs inform strategic decisions. Portfolio optimization, capital allocation, disposition strategy, and acquisition underwriting all benefit from the comprehensive, current data that automated systems provide. The shift from periodic manual reporting to continuous automated analysis changes not just how teams produce reports, but how they approach strategic questions.
Benchmarking and Comparative Analysis
With automated systems maintaining current data across a portfolio, comparative analysis becomes a regular practice rather than a special project. Asset managers can quickly identify which properties outperform or underperform on specific metrics, then investigate the operational drivers behind those differences. This continuous benchmarking supports data-driven resource allocation and best practice identification.
Internal benchmarking compares properties within a portfolio. External benchmarking requires market data, which automated systems can incorporate from services providing competitive rent surveys, absorption data, and market fundamentals. Platforms offering automated multifamily market analysis combine internal property data with external market intelligence to position portfolio performance in competitive context.
The analytical depth possible with automated data extends beyond simple peer ranking. Teams can identify which properties show the strongest response to specific operational initiatives, whether rent optimization programs, amenity upgrades, or marketing strategy shifts. This evidence base supports better capital deployment decisions and strategic planning.
Scenario Analysis and Forecasting
Current performance reporting answers the question of where a portfolio stands today. Strategic planning requires projecting future performance under various scenarios. Automated systems with forecasting capabilities apply historical trends, planned operational changes, and market assumptions to model future outcomes. These projections inform budgeting, capital planning, and investment strategy decisions.
Scenario analysis becomes particularly valuable when evaluating:
- Renovation timing and scope by modeling stabilized NOI under different improvement packages
- Disposition strategy comparing hold versus sell economics under various exit timing scenarios
- Acquisition underwriting stress-testing deal models with portfolio-calibrated assumptions
- Refinancing decisions evaluating debt structure options against projected cash flows
The combination of automated current reporting and forecasting tools creates a continuous analytical loop. Actual performance automatically updates models, scenario assumptions adjust based on realized trends, and strategic decisions incorporate the latest available data. This integration between reporting and planning represents a significant advance over manual processes where forecasts quickly become stale as actual results diverge from assumptions.
Implementation Considerations for Commercial Teams
Adopting automated real estate reporting requires thoughtful implementation planning. Technical integration, team training, process redesign, and change management all influence whether automation delivers its potential value. Organizations that treat implementation as purely a software deployment typically achieve limited results. Those that approach it as a workflow transformation supported by technology realize more substantial benefits.
Technical Architecture and Integration Requirements
The technical foundation for automated reporting starts with data access. Property management systems must expose data through APIs or scheduled exports. Accounting systems need similar integration paths. Organizations should inventory their current technology stack and evaluate integration options before selecting reporting automation platforms.
Key technical considerations include:
- Data refresh frequency capabilities supported by source systems and required by business needs
- Security protocols for credential management and data transmission
- Data residency requirements if portfolio includes international properties
- Scalability to accommodate portfolio growth without system rebuilding
Some organizations maintain data warehouses that already aggregate information from multiple source systems. In these environments, reporting automation can connect to the warehouse rather than individual source systems, simplifying integration architecture. Others pursue automation as a step toward better data centralization, using reporting requirements to drive broader data infrastructure improvements.
Platforms that offer native integration with common property management systems reduce implementation complexity significantly. When evaluating options, teams should prioritize systems with established connectors to their specific PMS and accounting platforms rather than generic tools requiring custom integration development.
Process Design and Stakeholder Alignment
Technology enables automated reporting, but process design determines how effectively it serves organizational needs. Implementation planning should map current reporting workflows, identify pain points, define desired future state processes, and design the transition path. This planning involves stakeholders across asset management, operations, finance, and investor relations.
Critical process questions include:
- Which reports will be fully automated versus which require manual supplementation?
- How will teams validate automated outputs before external distribution?
- What approval workflows apply to investor versus internal reports?
- How will exception handling work when data quality issues arise?
Stakeholder alignment on these process questions prevents mismatched expectations and supports smooth adoption. Finance teams worried about losing control need to understand validation mechanisms. Operations teams concerned about additional system complexity benefit from seeing how automation reduces rather than increases their workload. Investor relations professionals require confidence that automated reports meet existing commitments and disclosure standards.
The most successful implementations involve pilot phases where automation runs in parallel with existing manual processes. Teams can compare outputs, build confidence in accuracy, and refine configurations before fully transitioning to automated workflows. This measured approach reduces risk while building organizational buy-in.
Automated real estate reporting transforms multifamily portfolio management from periodic manual exercises into continuous analytical operations. The combination of direct data integration, configurable metrics, proactive alerts, and verifiable outputs addresses the core challenges commercial real estate teams face in monitoring performance and making informed decisions. Organizations ready to move beyond spreadsheet-based reporting can leverage platforms purpose-built for real estate analytics. Leni provides AI-powered portfolio management designed specifically for multifamily operators, with automated reporting, threshold alerts, and integrated analytics that connect directly to property management systems while maintaining full source attribution. Teams seeking to reduce reporting overhead while improving analytical depth should explore how specialized tools built for their industry can support both operational efficiency and strategic decision-making.
Leni is an AI analyst with a background in real estate.
Born in 2022, Leni works alongside asset managers, asset owners, and limited partners, helping teams stay oriented across systems like Yardi and Entrata. With an understanding of both operations and financials, Leni helps teams spot risk early and actively steps in by surfacing insights, creating alerts, and keeping work moving, decisions aligned, and momentum intact.
Get Portfolio Insights With Leni Analytics


