Company Reporting: A Complete Guide for Investment Teams

Company Reporting: A Complete Guide for Investment Teams
Company reporting stands as the backbone of investment decision-making, yet it remains one of the most time-intensive, error-prone workflows in asset management. Whether you're preparing quarterly investor updates, monthly portfolio performance summaries, or weekly asset-level variance reports, the quality of your company reporting directly impacts stakeholder trust, regulatory compliance, and strategic decisions. The challenge isn't just assembling numbers. It's reconciling disparate data sources, explaining variances with context, building narratives that matter, and making the entire process repeatable without sacrificing accuracy.
Define Your Reporting Audience First
Every company reporting workflow begins with a fundamental question: who will read this report, and what decisions will they make with it? Investment professionals waste countless hours producing comprehensive documents that miss the mark because they skip audience analysis.
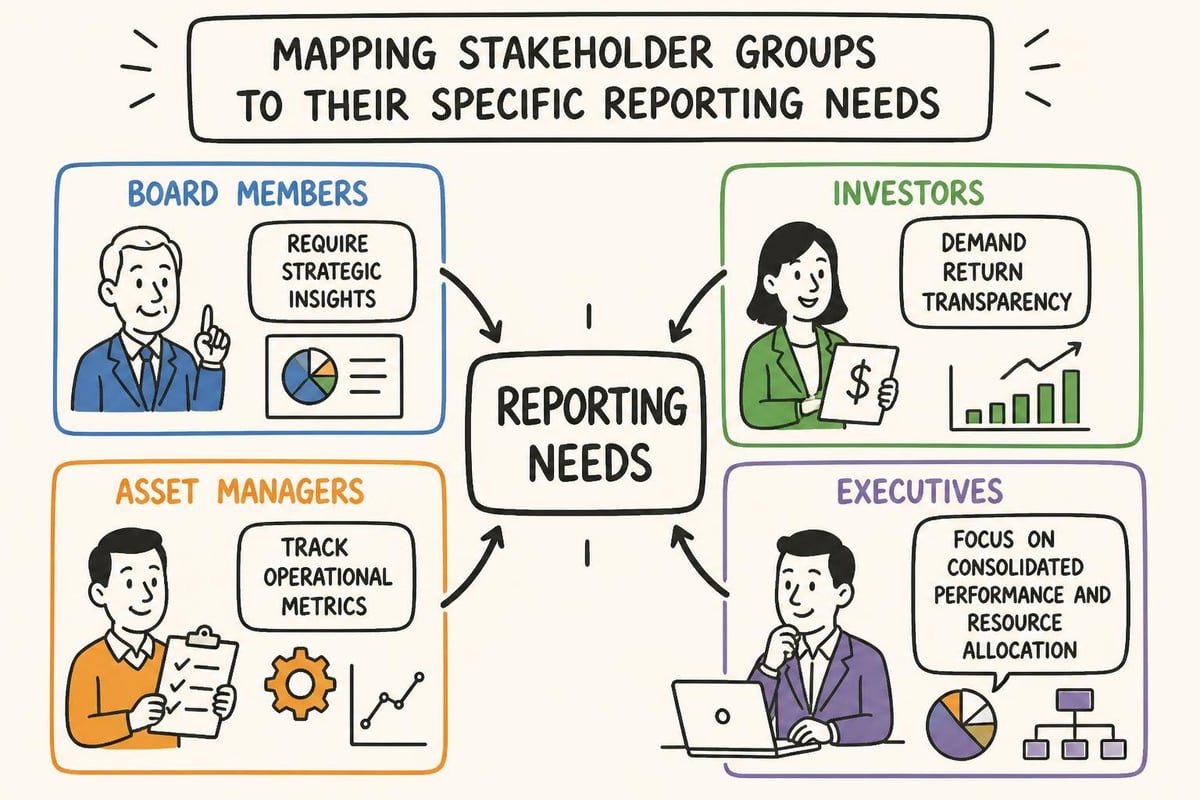
Board members need high-level strategic insights, risk exposure summaries, and performance against benchmarks. They don't want granular transaction details. Investors demand transparency on returns, fee structures, portfolio composition, and how their capital is deployed. Asset managers require operational metrics, budget variances, occupancy trends, and capital expenditure tracking. Executives focus on consolidated performance, emerging risks, and resource allocation recommendations.
Map each report type to its primary audience before selecting a single metric. A quarterly board package requires different depth than a monthly asset performance update. Understanding this distinction prevents scope creep and ensures your company reporting delivers actionable intelligence rather than information overload.
Stakeholder Requirements Matrix
Create a requirements matrix that documents what each audience needs, how often, and in what format. This framework becomes your reporting specification.
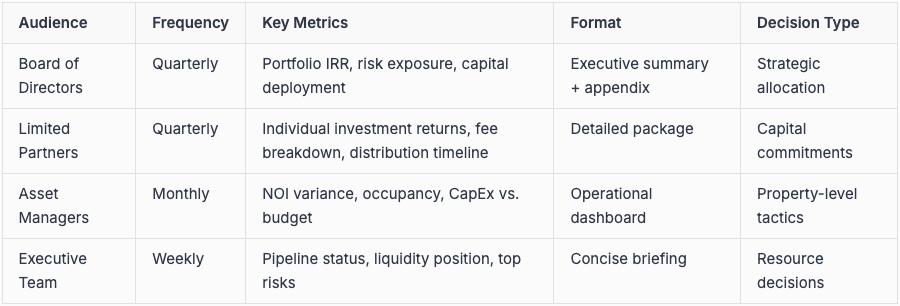
This matrix prevents the common trap of producing one-size-fits-all reports that satisfy no one. Best practices for board reporting emphasize tailoring content to decision-makers' specific needs rather than defaulting to comprehensive data dumps.
Choose Performance Indicators That Drive Action
Selecting the right KPIs transforms company reporting from retrospective scorekeeping into forward-looking decision support. Too many investment firms track metrics because they're available, not because they're meaningful.
Start with outcome metrics that connect to your investment thesis. For commercial real estate portfolios, this means tracking metrics like cash-on-cash return, debt service coverage ratio, same-store NOI growth, and occupancy trends. These indicators reveal whether assets perform according to underwriting assumptions.
Leading indicators deserve equal weight. Lease renewal rates signal future occupancy risk. Tenant improvement allowance requests forecast capital needs. Market rent growth indicates repositioning opportunities. Days to lease measures operational efficiency.
Build a tiered KPI framework:
Tier 1: Portfolio Performance - Overall returns, capital deployed, realized vs. unrealized gains
Tier 2: Asset-Level Metrics - Property NOI, occupancy, rent growth, expense ratios
Tier 3: Operational Efficiency - Reporting cycle time, data quality scores, variance explanation rates
Tier 4: Risk Indicators - Covenant compliance, concentration metrics, market exposure
Avoid vanity metrics that look impressive but don't inform decisions. Total square footage managed means nothing without context on performance per square foot. Number of assets matters less than return on those assets.
Effective data reporting practices stress defining metrics that trigger specific actions when thresholds are crossed, not just metrics that document what happened.
Gather Data From Multiple Sources Systematically
Company reporting in investment management requires synthesizing information from property management systems, accounting platforms, market research providers, loan servicers, and internal models. Each source operates on different timelines, formats, and quality standards.
Establish a data collection calendar that accounts for source availability. Month-end property financials typically arrive 5-10 days after period close. Market comparables require manual research. Capital account statements follow their own schedules. Your reporting timeline must accommodate these constraints.
Source Documentation Requirements
Create a data dictionary for every report that specifies:
Source system for each metric
Refresh frequency and typical lag
Responsible party for extraction
Quality checks required before use
Backup procedures when sources are unavailable
This documentation eliminates the scramble that happens when a key team member is unavailable. It also creates the foundation for automation. Automated real estate reporting systems depend on consistent source mapping and extraction logic.
For commercial real estate portfolios, typical sources include:
Yardi, MRI, or similar property management systems for operational data
QuickBooks, NetSuite, or general ledgers for financial actuals
CoStar, CompStak for market intelligence
Internal underwriting models for pro formas and benchmarks
Legal documents and loan agreements for covenant tracking
The complexity multiplies when managing diverse portfolios. A fund holding multifamily, office, and industrial assets might integrate data from six different property management platforms, each with unique chart of accounts structures.
Reconcile and Validate Before Analysis
Data reconciliation represents the highest-risk phase of company reporting. Mismatched figures between sources destroy credibility and trigger time-consuming investigation cycles during stakeholder reviews.
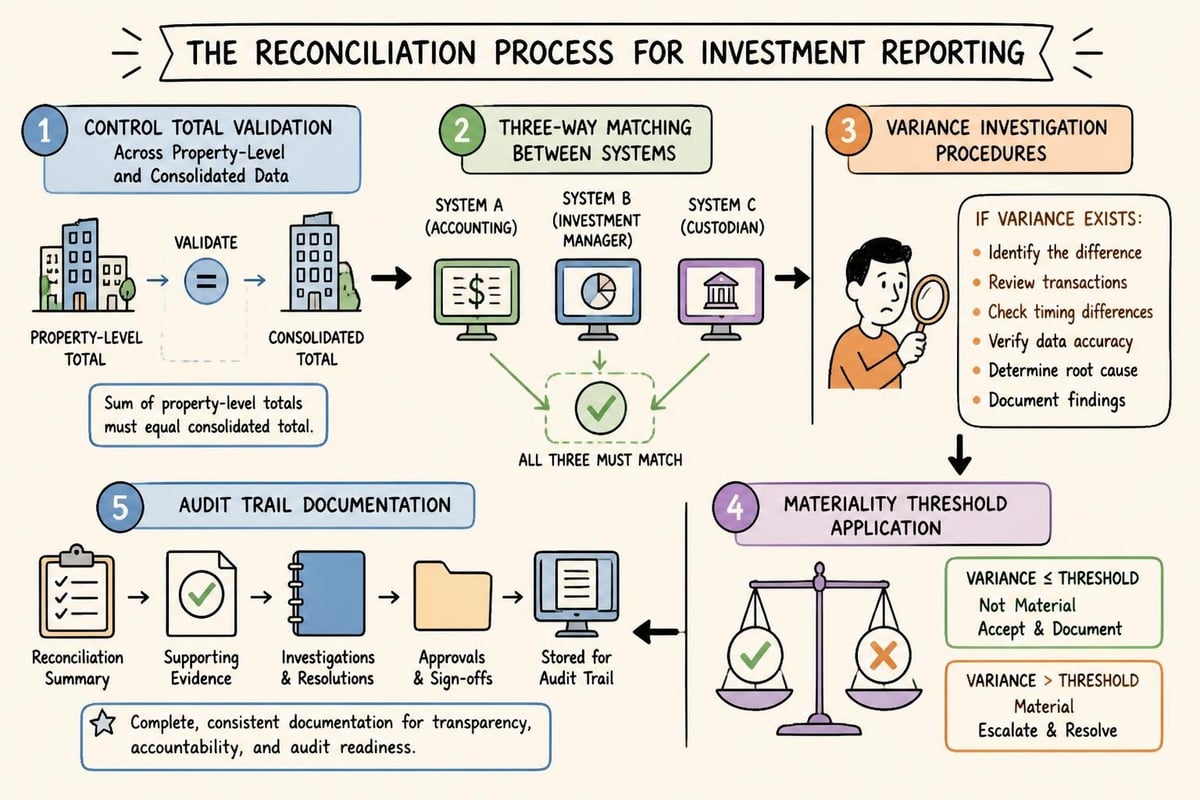
Build systematic reconciliation into your workflow, not as an afterthought. Start with control totals: does the sum of property-level revenue match the consolidated portfolio total? Do individual asset cash flows reconcile to the fund-level cash waterfall? Is debt outstanding per loan statements consistent with balance sheet liabilities?
Three-way reconciliation provides the strongest validation. For revenue recognition, verify that property management system income matches general ledger revenue and agrees with lease schedules. Discrepancies highlight timing differences, miscategorizations, or data quality issues.
Document every variance above materiality thresholds. Create a variance log that captures:
Metric name and reporting period
Expected value from each source
Actual variance amount and percentage
Root cause investigation
Resolution and correction applied
Responsible party and date resolved
This log becomes your audit trail and quality improvement database. Recurring variances signal process breakdowns or system configuration issues that need permanent fixes.
Management reporting best practices emphasize that credibility depends on consistent, verifiable data that stakeholders can trust without questioning every figure.
Explain Variances With Context and Narrative
Numbers without context create more questions than answers. Effective company reporting pairs quantitative results with qualitative explanations that help stakeholders understand performance drivers.
When NOI drops 8% quarter-over-quarter, your report must explain why. Was it a planned vacancy for renovation? Unexpected tenant default? Seasonal occupancy pattern? Budget assumption error? Each explanation carries different implications for future performance and required actions.
Structure variance narratives using a consistent framework:
State the variance: "Asset-level NOI decreased $47,000 (8.2%) vs. prior quarter"
Identify the driver: "Driven by planned vacancy of Suite 240 (12,000 SF) beginning March 1"
Provide context: "Vacancy enables $280,000 renovation to command $4.50/SF higher rents"
Forecast impact: "Expect NOI recovery to budget+5% by Q3 upon lease-up at new rates"
Flag action items: "Renovation on schedule; leasing agent reports strong prospect interest"
This structure transforms raw variance into actionable intelligence. Stakeholders understand what happened, why it happened, what it means for projections, and whether intervention is needed.
For portfolio-level company reporting, prioritize variances by magnitude and stakeholder relevance. Board reports should explain top five portfolio-level drivers. Asset manager reports need granular property-level detail. Match explanation depth to audience needs.
Tools that integrate document analysis with financial data can automatically surface relevant context. When explaining occupancy declines, referencing specific lease expiration dates, tenant correspondence, and market conditions creates more compelling narratives than numbers alone. AI investment monitoring capabilities can extract this context from structured and unstructured sources.
Build Narratives That Connect Data to Strategy
Great company reporting doesn't just document what happened. It connects performance to strategic objectives and investment theses, helping stakeholders understand whether the portfolio is on track.
Every investment has a value-creation story. A multifamily acquisition might target value-add through unit renovations and amenity upgrades. An office repositioning depends on lease-up at premium rents. A development project follows a construction and stabilization timeline. Your reporting narrative should measure progress against these specific plans.
Create a narrative outline before building tables and charts:
Executive Summary
Portfolio performance vs. benchmarks and prior periods
Top three performance drivers (positive and negative)
Strategic initiatives status and impact
Forward-looking risks and opportunities
Asset-Level Performance
Individual property results against business plans
Variance explanations with supporting details
Capital deployment and returns by asset
Operational metrics and trends
Market Context
Relevant market conditions affecting performance
Competitive positioning and market share
Regulatory or economic factors influencing strategy
Outlook and Recommendations
Updated projections based on actual performance
Strategic adjustments recommended
Resource needs and timing
This narrative structure ensures your company reporting tells a coherent story rather than presenting disconnected data points. Stakeholders can follow the logic from strategy through execution to results.
Executive reporting best practices recommend using clear, jargon-free language that focuses on insights rather than drowning readers in technical detail.
Review Assumptions and Update Projections
Company reporting serves dual purposes: documenting historical performance and informing forward projections. Every reporting cycle provides opportunities to validate or revise the assumptions underlying your models.
Compare actual results to underwritten projections systematically. When occupancy achieves 94% instead of projected 90%, ask whether higher stabilized occupancy is sustainable or temporary. When expense ratios exceed projections by 200 basis points, investigate whether it's a timing issue, market shift, or underwriting error.
Build an assumption tracker that logs:
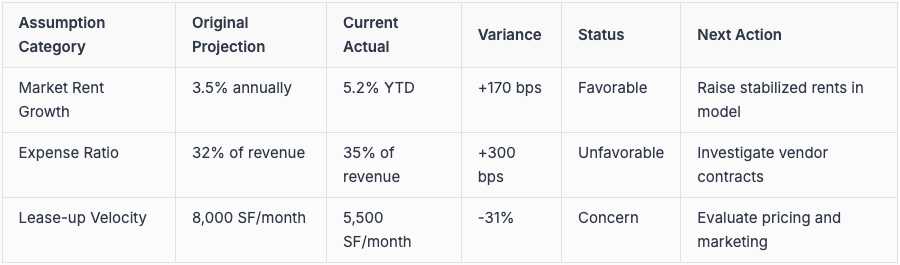
This systematic review prevents the dangerous practice of anchoring to outdated assumptions. Markets change. Buildings age differently than expected. Tenant behavior shifts. Your company reporting should trigger model updates when reality diverges from projections.
For portfolio and investment management teams, this feedback loop between reporting and modeling drives continuous improvement in underwriting accuracy and risk assessment.
Distribute Reports Through Appropriate Channels
Even brilliant analysis fails if it doesn't reach stakeholders in accessible formats through their preferred channels. Distribution strategy matters as much as content quality.
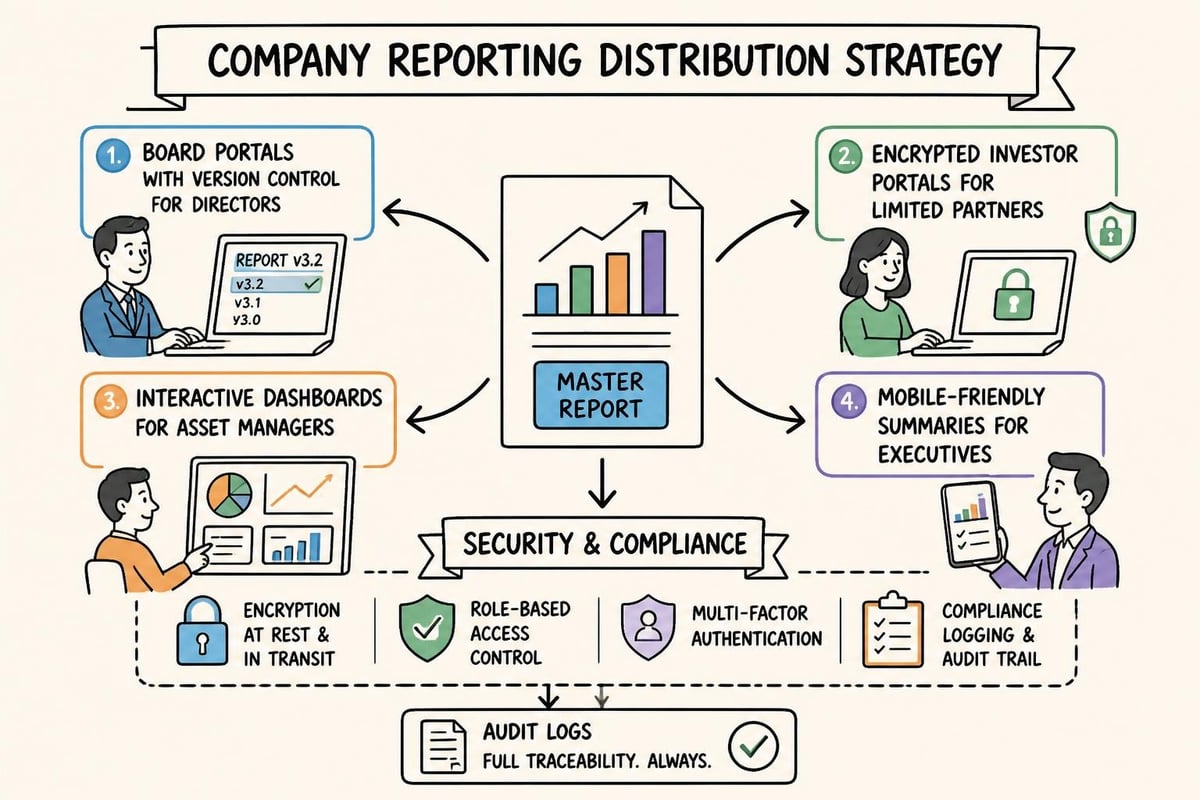
Board members typically receive reports through secure board portals with version control and access logging. Physical packages may still be required for certain governance protocols. Digital delivery enables timely updates but requires robust security.
Investors expect reports via encrypted email or investor portal access, with clear version identifiers and delivery confirmations. Track distribution to ensure compliance with reporting obligations specified in partnership agreements.
Internal teams need flexible access to underlying data, not just formatted reports. Asset managers benefit from dashboards they can filter and drill into. Executives want mobile-friendly summaries they can review between meetings.
Distribution Checklist
Before sending any company reporting package:
Verify completeness: All required sections, exhibits, and supporting schedules included
Check formatting: Consistent fonts, aligned tables, working hyperlinks, proper pagination
Validate calculations: All formulas producing expected results, no broken references
Review narratives: Grammar checked, names spelled correctly, dates accurate
Confirm security: Appropriate access controls, encryption for sensitive data
Document distribution: Log recipients, delivery timestamp, version number
For regulated entities, financial reporting requirements may mandate specific filing protocols, retention periods, and audit trails. Your distribution process must accommodate these compliance obligations.
Make Recurring Reporting Repeatable and Scalable
The real test of company reporting maturity is how efficiently you produce the next cycle's reports. Manual, heroic efforts don't scale as portfolios grow or stakeholder demands increase.
Transform one-time reports into repeatable processes through standardization and automation. Create report templates with consistent structure, formatting, and calculation logic. Build data pipelines that automatically extract, transform, and load information from source systems. Develop variance analysis rules that flag material changes for review.
Standardize without sacrificing relevance. While templates ensure consistency, they must accommodate asset-specific nuances. A multifamily property reports different operational metrics than an office building. Your framework should handle these variations systematically rather than through manual workarounds.
Build a reporting calendar that maps all deliverables, deadlines, dependencies, and responsible parties:
T+5 days: Property managers submit financials to asset management
T+7 days: Asset management completes reconciliation and variance analysis
T+10 days: Finance consolidates portfolio results and prepares draft reports
T+12 days: Investment committee reviews and provides feedback
T+15 days: Final reports distributed to stakeholders
This timeline creates accountability and identifies bottlenecks before they become emergencies. When property financials consistently arrive late, you can address the root cause rather than scrambling each month.
Secure AI for investment firms enables automation while maintaining the accuracy and auditability that investment reporting demands. Systems that can interpret unstructured data, reconcile across sources, generate variance narratives, and produce formatted reports reduce manual effort while improving consistency.
Leverage Technology for Accuracy and Efficiency
Modern company reporting requires technology that goes beyond spreadsheets and static templates. Investment firms managing complex portfolios need platforms that integrate data sources, automate reconciliation, generate narratives, and maintain audit trails.
Enterprise reporting platforms should provide:
Connections to property management systems, accounting platforms, and market data sources
Automated reconciliation logic with variance flagging
Template libraries for common report types
Workflow management with review and approval routing
Version control and change tracking
Permissioned access based on role and sensitivity
Export capabilities for distribution in multiple formats
The technology stack must balance automation with control. Fully automated reports that bypass human review risk propagating errors at scale. The optimal approach combines automated data processing with human judgment on interpretation and narrative.
For firms balancing immediate needs with long-term scalability, real estate investment analysis software options range from subscription-based tools for teams that upload files and need polished outputs, to enterprise platforms with connected data, governance, and audit capabilities.
Look for systems that prioritize accuracy verification over speed alone. Verifiable AI outputs matter more than rapid generation when stakeholder trust depends on report credibility. The platform should surface its logic, cite sources, and enable users to trace any figure back to original data.
Address Common Company Reporting Challenges
Investment teams face recurring obstacles that undermine reporting quality and efficiency. Recognizing these patterns enables proactive solutions.
Challenge: Inconsistent data definitions across assets or funds Different acquisitions come with different systems, accounts, and terminology. Establish a master data dictionary and map all sources to standard definitions. When "maintenance expense" means different things across properties, consolidated reports become meaningless.
Challenge: Manual data entry errors Humans mistype numbers, transpose digits, and paste values into wrong cells. Eliminate rekeying through direct system integrations. When manual input is unavoidable, implement dual-entry verification or automated validation rules.
Challenge: Late source data disrupting deadlines Build buffer time into your calendar and establish escalation procedures for late submissions. Consider provisional reporting with clearly flagged estimates that update when actuals arrive.
Challenge: Variance explanations that are generic or missing Train teams on effective narrative writing and provide templates with good examples. Make variance explanation a required field in your process, not an optional add-on.
Challenge: Reports that grow longer without becoming more useful Audit your reports annually. Remove sections that stakeholders don't reference. Challenge every table and chart to justify its inclusion. Reporting best practices emphasize that clarity comes from exclusion as much as inclusion.
Challenge: Difficulty comparing current to prior periods Maintain consistent calculation methodologies period-over-period. When you must change an approach, restate prior periods or clearly disclose the impact of methodology changes.
Integrate Reporting With Broader Workflows
Company reporting shouldn't exist in isolation. It connects to underwriting, asset management, investor relations, compliance, and strategic planning. Breaking down these silos improves both reporting quality and organizational efficiency.
Link reporting to asset business plans: Every variance explanation should reference the original investment thesis and business plan. This connection helps stakeholders assess execution against strategy.
Feed reporting insights back to underwriting: Systematic variance analysis reveals which assumptions consistently prove optimistic or conservative. This feedback loop improves future deal evaluation.
Align reporting with investor communication: Quarterly reports should preview earnings calls and investor meetings, not contradict them. Coordinate timing and messaging across channels.
Support compliance and audit needs: Design reporting processes with audit trails, supporting documentation, and control testing built in from the start. Retrofitting compliance is painful.
For firms using commercial real estate technology stacks, integration means data flows between systems without manual handoffs. When your property management system, accounting platform, and reporting tool share common data models, reconciliation happens automatically.
Measure and Improve Your Reporting Process
Treat company reporting as a process that deserves continuous improvement, not a necessary burden to endure. Track metrics on reporting effectiveness and efficiency.
Quality metrics reveal whether reports meet stakeholder needs:
Stakeholder satisfaction scores from quarterly surveys
Number of follow-up questions requiring clarification
Error rate per report (corrections required after distribution)
Audit findings related to reporting processes
Efficiency metrics show where process improvements deliver value:
Hours invested per report type
Cycle time from period close to report delivery
Percentage of reporting hours spent on data gathering vs. analysis
Automation rate for standard calculations and formatting
Set improvement targets and track progress. If investor report production requires 80 hours monthly, aim to reduce it to 60 hours through automation and process refinement while maintaining or improving quality.
Conduct post-mortem reviews after major reporting cycles. What went well? What caused delays or errors? What should change for next quarter? Document lessons learned and update procedures accordingly.
GRC reporting best practices emphasize building feedback loops that turn reporting into a continuous improvement discipline rather than a repetitive task.
Mastering company reporting transforms it from a compliance burden into a strategic asset that drives better investment decisions, stronger stakeholder relationships, and operational excellence. By defining clear audiences, selecting meaningful metrics, reconciling data systematically, explaining variances with context, and making processes repeatable, investment teams build reporting workflows that scale with portfolio growth. Leni helps investment and asset management teams eliminate the manual, error-prone work that slows down reporting cycles, turning documents, spreadsheets, and system exports into verified reports, variance narratives, and recurring updates with the accuracy and auditability that enterprise workflows demand.

Johanna Gruber
Johanna has spent the last 8 years helping marketing teams connect with audiences through content. Specializing in B2B SaaS and real estate.
Curious About AI?
Join the largest AI community for real estate online. Get bite-sized, real-world use case videos, plus practical tips and proven strategies from top industry experts on adopting AI effectively.
MEET LENI
AI SuperAgent Purpose Built for Investors and Operators.
Experience how professionals and teams in your domain are getting the edge using AI.