Data Analyst AI: From Charts to Finished Deliverables
Data Analyst AI: From Charts to Finished Deliverables
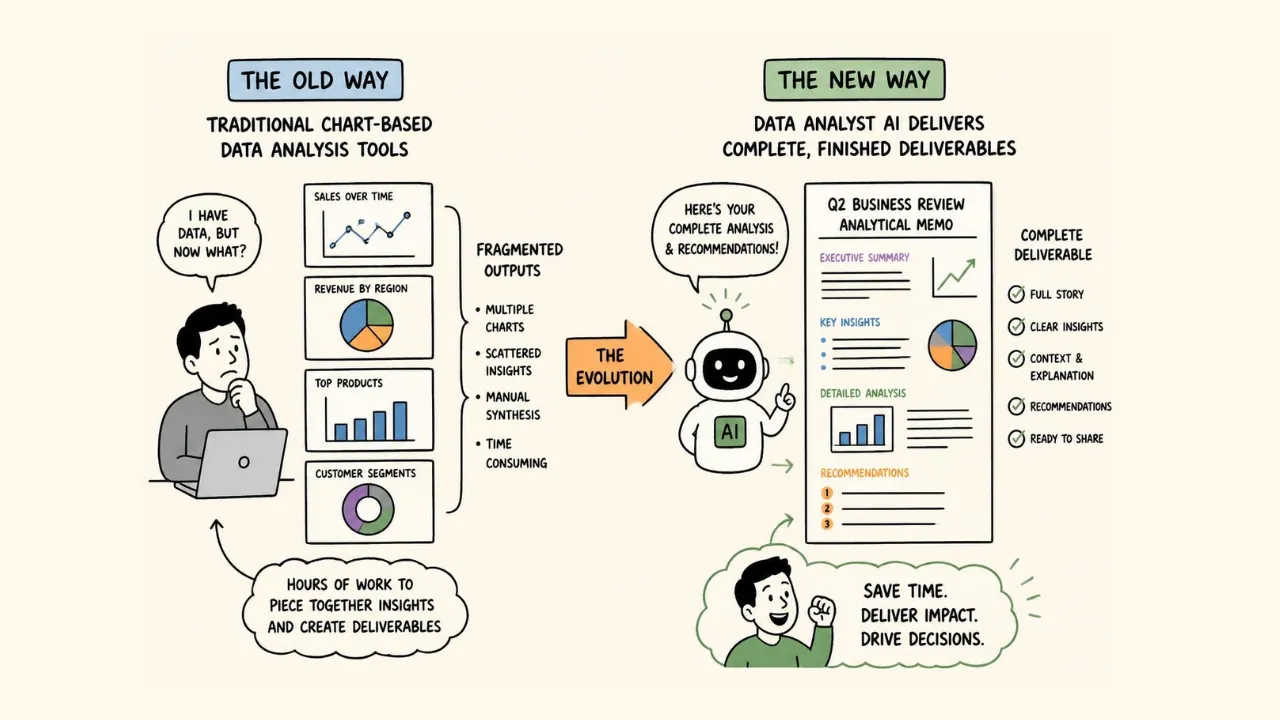
The commercial real estate industry generates more data than most asset managers can analyze effectively. Every property management system contains thousands of rows of rent rolls, operating statements, tenant demographics, and maintenance records. Traditional business intelligence tools help visualize this information, but they stop at charts and dashboards. The best data analyst AI platforms go further, delivering finished analytical work that formerly took analysts days to compile: completed NOI variance reports, fully sourced market research studies, drafted IC memos with supporting exhibits, and delinquency summaries ready for distribution. That fundamental shift from fragmented outputs to complete deliverables is changing what it means to work as an analyst in asset management.
What Separates Output-Quality Data Analyst AI From Generic Tools
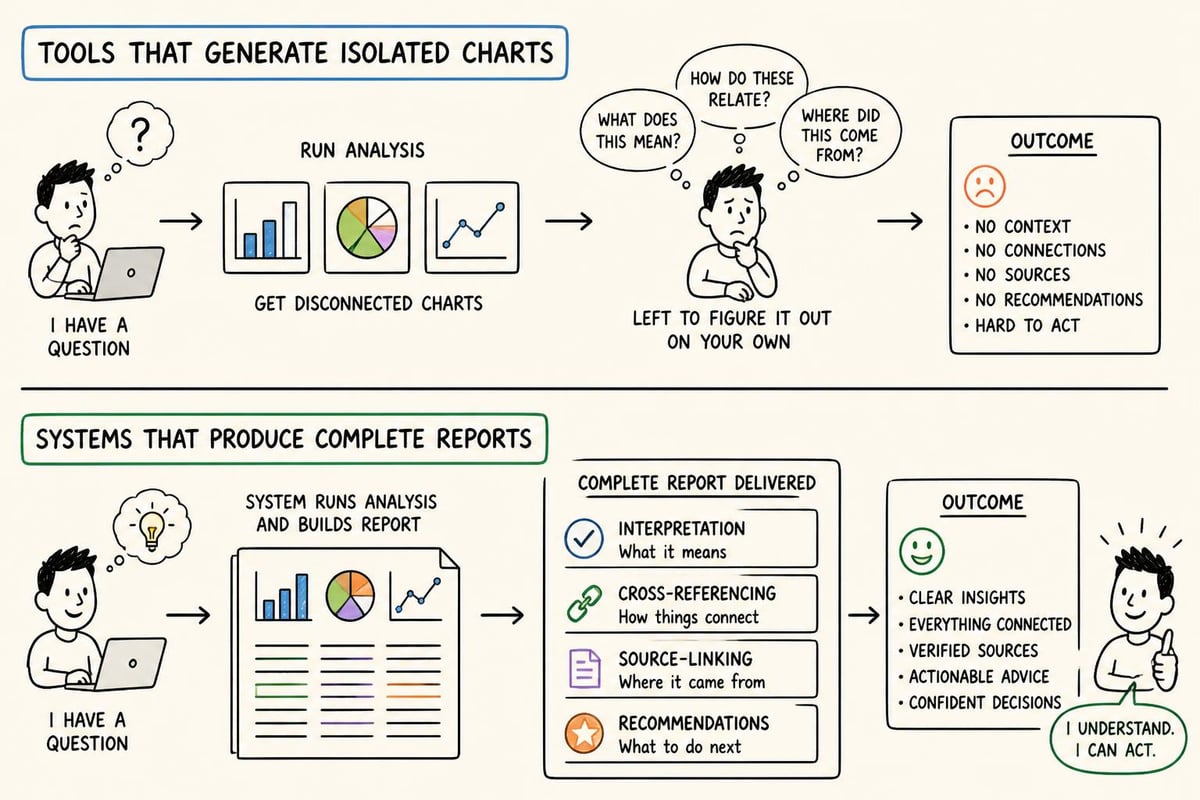
Generic business intelligence platforms excel at one thing: transforming raw data into visual representations. You connect a data source, select fields, and receive a chart. That capability solves part of the analytical challenge, but it leaves the hardest work untouched. After generating a visualization, someone still needs to interpret the finding, cross-reference it with other data sources, verify assumptions against market research, draft explanatory text, format everything into a coherent document, and link each claim to its source material.
Data analyst AI that produces finished work handles every step in that chain. Instead of stopping at a chart showing occupancy trends across a multifamily portfolio, the system generates a complete report that explains why occupancy declined in three properties, compares those properties to market benchmarks, identifies which lease expirations contributed to the variance, and provides specific recommendations with supporting data linked directly to the source lease documents and market studies.
The Three Dimensions That Define Finished Analytical Output
The difference between a chart and a finished deliverable breaks down into three distinct capabilities:
Completeness of Analysis
Traditional BI: Produces individual charts, pivot tables, or dashboards that require manual interpretation
High-output data analyst AI: Delivers complete documents that include data, interpretation, context, recommendations, and next steps
The analyst receives a finished product, not raw material that still requires hours of assembly
Source Verification and Linking
Traditional BI: Shows aggregated numbers without direct connection to underlying source documents
High-output data analyst AI: Links every figure, claim, and insight directly to the source lease, operating statement, market report, or property management system record
Verifiability transforms analytical output from "probably accurate" to "demonstrably correct"
Analytical Depth and Multi-Step Reasoning
Traditional BI: Executes single queries or pre-configured dashboards
High-output data analyst AI: Runs multi-step analyses that chain together data extraction, cross-referencing, variance calculation, market comparison, and synthesis into coherent findings
Complex questions receive complete answers, not component parts requiring manual assembly
This distinction matters because analytical AI deserves equal attention alongside the generative capabilities that dominate current discussion. The value lies not in creating content, but in transforming raw commercial real estate data into actionable intelligence that drives investment decisions.
How Finished Work Changes What Analysts Actually Do
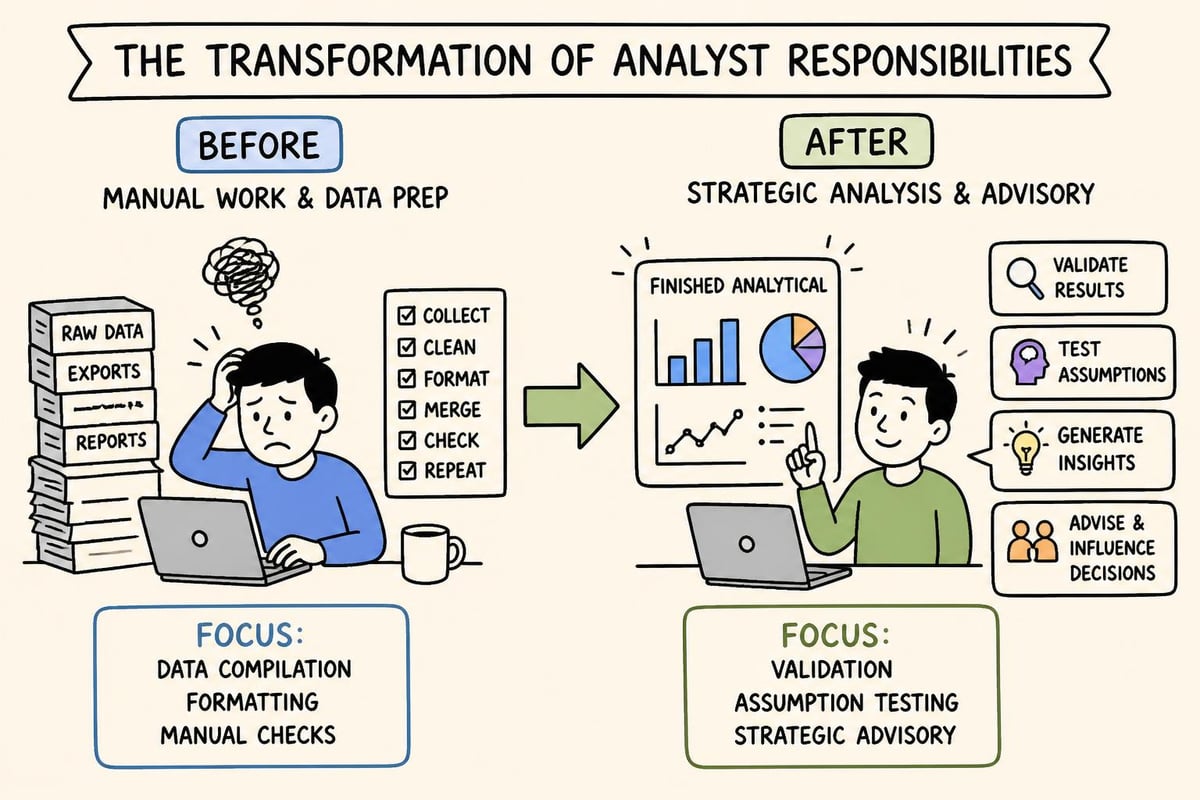
When data analyst AI handles mechanical assembly, the analyst role shifts from compiler to quality controller and strategic advisor. This transition mirrors what happened in financial modeling when Excel eliminated hand calculations. The skill moved from arithmetic accuracy to logical model structure and assumption quality. The same pattern now applies to analytical work.
From Data Assembly to Judgment and Validation
Consider a typical monthly asset management reporting cycle for a 20-property multifamily portfolio. The traditional workflow requires analysts to:
Export data from Yardi or RealPage for each property
Reconcile operating statements against budgets
Calculate variance percentages for key line items
Research explanations for significant variances
Draft narrative explanations for each property
Compile everything into formatted reports for limited partners
Add charts, tables, and supporting exhibits
Review and revise for accuracy
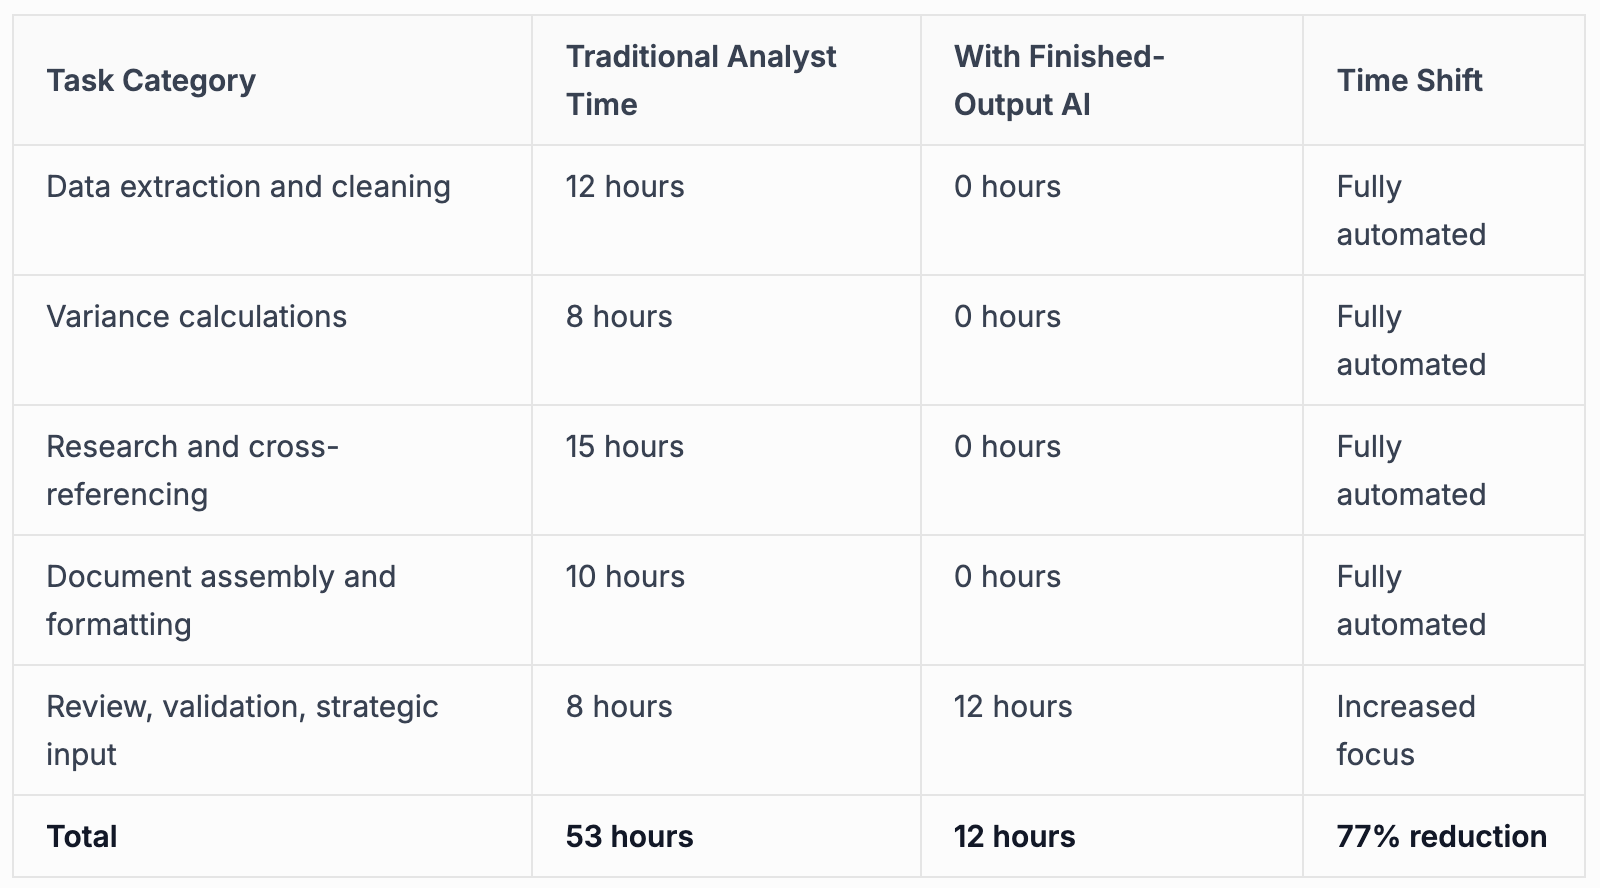
This process consumes 40-60 hours per month for a mid-sized portfolio. High-output data analyst AI collapses steps 1-7 into automated execution, leaving analysts to focus exclusively on step 8: reviewing output quality, validating findings against their property knowledge, and adding strategic context that only human judgment provides.
The time saved doesn't eliminate the analyst. Instead, it redirects analytical capacity toward higher-value activities: questioning assumptions in acquisition underwriting, identifying portfolio optimization opportunities, developing new performance metrics, and advising on strategic decisions that affect NOI and valuation.
What Data Analyst AI Does in Practice: Commercial Real Estate Examples
Abstract capabilities matter less than concrete outputs. Here's what finished analytical work looks like when applied to commercial real estate asset management:
NOI Variance Reports
A properly executed NOI variance report doesn't just show that Net Operating Income declined 7% year-over-year. It identifies which line items drove the variance (property taxes up 12%, repairs and maintenance up 18%, other income down 22%), cross-references those changes against budget assumptions and market norms, links each figure to the specific general ledger entry or invoice in the property management system, and explains the business reason behind each significant variance (major HVAC replacement, tax assessment appeal in progress, loss of laundry income due to contract renegotiation).
Data analyst AI that delivers finished work produces that complete report autonomously. The analyst receives a document ready for distribution to ownership, not a spreadsheet requiring interpretation and narrative construction.
Delinquency Analysis and Collections Summaries
Tracking delinquent tenants across a portfolio requires extracting current rent roll data, identifying accounts with outstanding balances, categorizing delinquency by severity and duration, reviewing lease terms for relevant clauses, checking payment history to distinguish chronic late payers from one-time incidents, and compiling everything into actionable recommendations for property management follow-up.
Traditional tools provide the delinquency list. High-output data analyst AI provides the complete analysis: tenant names, outstanding amounts, delinquency duration, lease expiration dates, payment history patterns, relevant lease clauses, recommended next steps, and source links to every underlying lease document and payment record. The difference between a data export and finished analytical work.
Market Research Studies for Acquisitions
Conducting market research for potential acquisitions traditionally involves searching multiple data sources, compiling demographic trends, gathering competitive property information, analyzing rent growth patterns, researching employment and economic indicators, and synthesizing findings into a coherent narrative that supports or challenges the acquisition thesis.
Data analyst AI built for finished output executes that entire research workflow autonomously: identifying relevant markets, gathering current data from multiple sources, analyzing trends, comparing the subject property to competitive assets, and delivering a complete market research study with every figure linked directly to its source. The analyst reviews the study for reasonability and adds local market knowledge, rather than spending days compiling the research from scratch.
IC Memo and Investment Committee Deck Creation
Investment committee materials require synthesizing property financials, market research, acquisition assumptions, risk factors, and return projections into formatted documents that communicate the investment thesis clearly. This synthesis work typically consumes 15-20 hours per deal.
Systems designed for finished analytical output transform this process. Instead of manually assembling components, the analyst provides the property address and basic acquisition parameters. The data analyst AI platform extracts financial data, conducts market research, builds financial models and underwriting, identifies risk factors, generates return scenarios, and produces draft IC memos and presentation decks with every assumption and figure linked to source documentation.
The Technical Architecture Behind Verifiable Analytical Output
Generic AI tools generate plausible-sounding answers that may or may not reflect actual data. This limitation makes them unsuitable for financial analysis where accuracy is non-negotiable. The technical difference lies in architecture: how the system connects to data sources, processes information, and generates output.
Direct Integration Versus Manual Upload
Traditional approaches to what an AI data analyst actually does involve uploading CSV files or connecting to generic databases. This method introduces multiple points of data degradation: export errors, version control issues, manual data cleaning, and disconnection from source systems.
Purpose-built data analyst AI for commercial real estate connects directly to property management systems. Integration with Yardi, RealPage, and Entrata means the analytical engine pulls current data automatically, maintains connection to source records, and updates outputs when underlying data changes. This direct connectivity enables true source-linking: every figure in an analytical report includes a direct reference to the exact general ledger line, lease clause, or property record from which it derived.
Long-Running Multi-Step Tasks Versus Single Queries
Most AI analysis tools execute simple queries: "Show me occupancy by property" or "Calculate average rent growth." These single-step operations mirror traditional BI functionality. The limitation becomes obvious when the question requires multiple analytical steps executed in sequence.
Consider this request: "Identify properties where actual operating expenses exceeded budget by more than 10%, determine which expense categories drove the variance, compare those variances to portfolio averages and market benchmarks, extract relevant budget assumptions from last year's underwriting model, and explain why the variance occurred."
Answering that question requires six distinct analytical operations, each building on the previous step's output. Generic tools cannot chain these operations autonomously. An analyst must manually execute each step and synthesize results. High-output data analyst AI runs the entire sequence without human intervention, maintaining context across steps and producing a finished analytical report.
Accuracy Improvement Through Data Ingestion
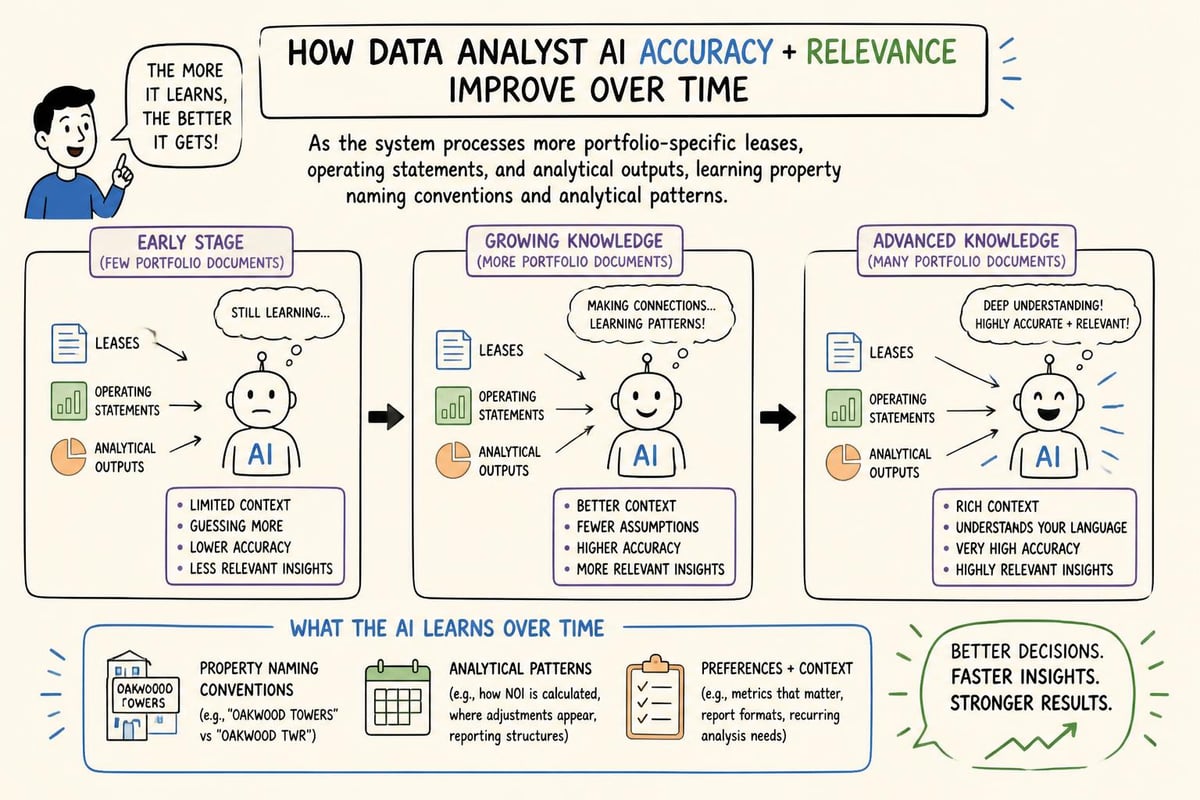
Static AI models trained on general datasets produce the same quality output regardless of usage. They don't learn from your specific portfolio's characteristics, naming conventions, or analytical patterns. This limitation creates ongoing accuracy issues as the model misinterprets property-specific terminology or applies generic assumptions to unique situations.
Advanced data analyst AI platforms improve accuracy as they ingest more data. Every lease analyzed, every operating statement processed, and every market research study completed trains the system on your portfolio's specific characteristics. Property naming conventions, typical expense ratios, lease term patterns, and analytical preferences become embedded in the system's processing logic. The 100th report generated for your portfolio demonstrates materially higher accuracy than the first because the platform has learned your specific context.
This learning capability transforms data analyst AI from a static tool into an increasingly valuable analytical asset. The system becomes more reliable, requires less human review, and produces more relevant outputs over time.
Security and Verification Standards for Financial Analysis
Commercial real estate deals involve confidential financial information, proprietary acquisition strategies, and sensitive tenant data. Using data analyst AI for this work requires security infrastructure that meets institutional standards. Generic AI tools built for consumer applications lack necessary controls.
SOC 2 Type 2 certification provides independent verification that security controls meet institutional requirements. This certification covers:
Data encryption in transit and at rest
Access controls and authentication
System availability and incident response
Processing integrity and accuracy
Privacy controls for sensitive information
These technical controls matter because they determine whether institutional asset managers can actually use data analyst AI for real analytical work or must limit it to non-sensitive tasks. The difference between a demonstration tool and production infrastructure.
Source-linking provides the second critical verification mechanism. When every figure in an analytical report links directly to the underlying lease clause, general ledger entry, or market data source, reviewers can verify accuracy without rebuilding the entire analysis from scratch. This verifiability transforms AI-generated analysis from "probably correct" to "demonstrably accurate."
What the Analyst Role Becomes When AI Handles Mechanical Work
The transformation from mechanical execution to strategic judgment represents the most significant shift in analytical work since spreadsheet software eliminated hand calculations. Understanding this shift requires examining what analysts actually do once data compilation and document assembly become automated.
Strategic Assumption Testing
Financial modeling and underwriting depend on assumptions: rent growth rates, expense escalation, capital expenditure timing, and exit cap rates. Traditional analyst work focuses on implementing these assumptions correctly in Excel models. When data analyst AI handles model construction, analytical focus shifts to testing whether the assumptions themselves make sense.
Does the projected 3% annual rent growth align with historical performance for this specific property class and submarket? Do the assumed expense ratios reflect actual operating history or wishful thinking? Are capital expenditure reserves adequate given the property's age and condition? These judgment calls require deep market knowledge and critical thinking that AI cannot replace.
Analysts spend less time building models and more time stress-testing assumptions, identifying overlooked risks, and challenging overly optimistic projections. This shift improves underwriting quality because analytical talent focuses on judgment rather than mechanical calculation.
Exception Investigation and Contextual Analysis
Automated analysis excels at identifying anomalies: properties with unusual expense ratios, tenants with irregular payment patterns, or markets with divergent performance trends. The system flags these exceptions reliably. Understanding why they occurred requires contextual knowledge.
Why did property maintenance expenses spike 40% in Q3? The data analyst AI identifies the variance and links to the underlying invoices. The analyst determines whether it represents a one-time roof repair, deferred maintenance finally addressed, or a systemic problem requiring management intervention. That distinction drives entirely different responses.
This contextual interpretation represents irreducible analytical value. Data reveals what happened. Experience and judgment explain why it matters and what to do about it.
Communication and Stakeholder Management
Finished analytical reports generated by data analyst AI provide the foundation for investor communication, but they don't replace human judgment about what to emphasize, how to frame challenging results, or when to provide additional context beyond what data alone reveals.
An automated NOI variance report accurately identifies that property operating expenses exceeded budget by 15%. The analyst determines how to present this finding to limited partners: as a concerning trend requiring management changes, as expected integration costs from a recent acquisition, or as market-wide expense inflation affecting all comparable properties. The framing matters as much as the underlying numbers.
Practical Implementation: What Changes in Daily Workflow
Moving from traditional analytical methods to AI-generated finished work requires workflow adjustments. Teams accustomed to building reports from scratch must adapt to reviewing and validating instead.
The transition typically follows this pattern:
Month 1-2: Parallel Processing
Run both traditional manual processes and AI-generated outputs in parallel. Compare results, identify discrepancies, and calibrate the system's understanding of portfolio-specific conventions. This validation period builds confidence and surfaces areas requiring adjustment.
Month 3-4: Primary with Review
Shift to using AI-generated outputs as the primary deliverable, with analysts reviewing and refining before distribution. Review time averages 25-30% of the traditional manual creation time. Focus shifts to validating assumptions, adding strategic context, and ensuring outputs align with stakeholder needs.
Month 5+: Production Mode
Established workflows with AI-generated first drafts requiring minimal revision. Time savings reach 70-80% for routine analytical work. Freed capacity redirects to strategic projects: portfolio optimization studies, acquisition pipeline analysis, and proactive performance monitoring.
This progression requires approximately five months to reach full productivity. Teams that rush implementation without adequate validation risk accuracy issues. Teams that remain in permanent parallel-processing mode miss the productivity benefits.
The Benchmark for High-Output Data Analyst AI in Commercial Real Estate
Not all data analyst AI platforms deliver finished analytical work. Most stop at charts or simple summaries. Purpose-built systems designed specifically for commercial real estate asset management set a different standard.
The defining characteristics of high-output platforms include:
Long autonomous task execution: Running multi-step analytical workflows from data extraction through final document creation without human intervention
Verifiable source-linked outputs: Direct links connecting every figure and claim to underlying source documents in property management systems or market databases
Direct PMS connectivity: Native integration with Yardi, RealPage, and Entrata enabling real-time data access and continuous source-linking
Accuracy improvement through data ingestion: Systems that learn portfolio-specific patterns and terminology to deliver increasingly relevant outputs over time
Security infrastructure meeting institutional standards: SOC 2 Type 2 certification enabling use with confidential financial data
Advanced asset portfolio management requires these capabilities working in concert. Charts without context provide limited value. Context without source-linking creates verification burdens. Source-linking without multi-step reasoning leaves the hard analytical work to humans.
The platform benchmark combines all these elements: autonomous execution of complex analytical tasks producing finished, verifiable deliverables that improve in accuracy as the system processes more portfolio-specific data. This standard transforms data analyst AI from an interesting experiment into production infrastructure that materially changes how asset management teams operate.
Understanding what distinguishes AI data analysts from traditional analytical roles requires seeing this complete picture. The role evolves from manual data compilation toward strategic judgment, assumption testing, and contextual interpretation. The mechanical layer becomes automated. The judgment layer becomes more important.
The tools that enable this transition share common architectural characteristics: purpose-built for specific industries rather than generic application, designed to produce finished deliverables rather than component parts, connected directly to source systems rather than operating on exported data, and improving in accuracy through continuous data ingestion rather than remaining static.
Data analyst AI that produces finished analytical work fundamentally changes what asset managers spend time on: less mechanical assembly, more strategic judgment, and better-informed decision-making. Leni provides the platform infrastructure that makes this shift practical for commercial real estate teams, with autonomous task execution, source-linked outputs, direct property management system integration, and accuracy that improves as your team uses it. Experience how finished analytical deliverables change your workflow.

Johanna Gruber
Johanna has spent the last 8 years helping marketing teams connect with audiences through content. Specializing in B2B SaaS and real estate.
Curious About AI?
Join the largest AI community for real estate online. Get bite-sized, real-world use case videos, plus practical tips and proven strategies from top industry experts on adopting AI effectively.
MEET LENI
AI SuperAgent Purpose Built for Investors and Operators.
Experience how professionals and teams in your domain are getting the edge using AI.