How to Analyze an Investment Property: A Complete Guide
.webp&w=1920&q=75)
How to Analyze an Investment Property: A Complete Guide
Most acquisitions teams follow the same inefficient playbook when evaluating deals: download documents, manually extract data into spreadsheets, build models from scratch, hunt for comparable properties that may not tie out, and repeat this process for every opportunity. This approach consumes hours or days per property and introduces errors that compound through the underwriting process. Learning how to analyze an investment property correctly means understanding both the fundamental metrics and the workflow that delivers accurate, defensible results. This guide walks through the complete analysis process, from initial data gathering to final investment recommendation, with a focus on the inputs, outputs, and tools that separate thorough analysis from guesswork.
Gather Essential Property Documents and Data
Before calculating a single metric, you need complete and accurate source documents. The quality of your analysis depends entirely on the quality of your inputs.
Required Documents for Commercial Property Analysis
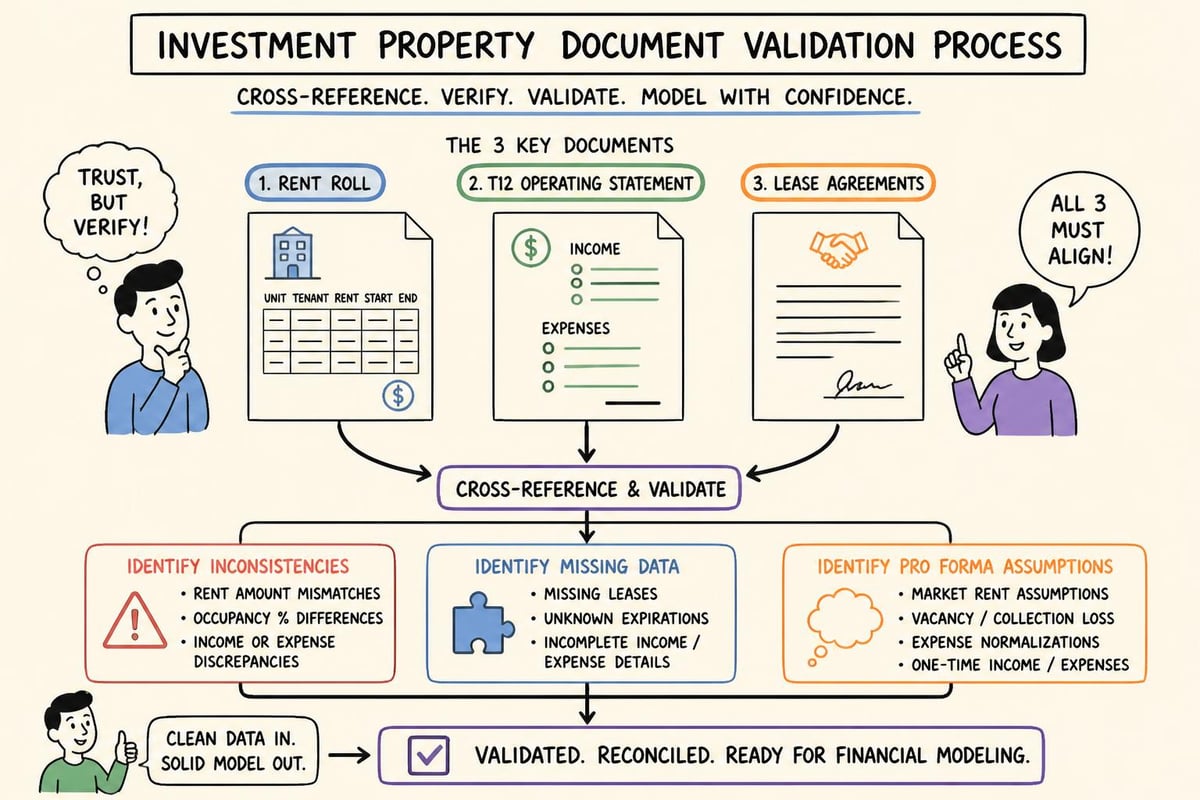
Every thorough property analysis starts with three foundational document types:
Rent rolls showing current tenant roster, lease terms, square footage, rental rates, and expiration dates
Trailing twelve-month operating statements (T12s) detailing actual income and expenses over the past year
Offering memorandums (OMs) containing property details, market positioning, and seller projections
Additional documents strengthen your analysis:
Historical operating statements (ideally three to five years)
Current lease agreements for major tenants
Capital expenditure reports and deferred maintenance assessments
Property condition reports and environmental assessments
Local market reports and comparable sales data
The document extraction process traditionally requires manual data entry, consuming hours and introducing transcription errors. Modern platforms automate this step, pulling structured data directly from PDFs and connecting it to your financial models.
Validate Data Accuracy Before Analysis
Raw documents often contain inconsistencies. Rent rolls may not match lease files. Operating statements may categorize expenses differently year over year. Seller proformas frequently present optimistic assumptions.
Create a validation checklist:
Cross-reference rent roll totals against actual lease agreements
Compare T12 income against bank statements or audited financials when available
Identify unusual expense items or categories that seem understated
Flag tenants approaching lease expiration within 12 months
Note any revenue or expense items marked as "pro forma" rather than actual
This verification step prevents downstream errors that invalidate your entire analysis. When accuracy matters, almost right is wrong.
Calculate Core Financial Performance Metrics
Understanding how to analyze an investment property requires mastering four foundational metrics that reveal different aspects of property performance and investment return.
Net Operating Income (NOI)
Net Operating Income represents the property's annual income after operating expenses but before debt service and capital expenditures. This metric serves as the foundation for most other calculations.
NOI Formula: Gross Potential Rent + Other Income - Vacancy Loss - Operating Expenses = NOI
Operating expenses include:
Property management fees (typically 3% to 5% of effective gross income)
Property taxes and insurance
Utilities paid by landlord
Repairs and maintenance
Administrative costs
Marketing and leasing commissions
Operating expenses exclude:
Mortgage payments (debt service)
Capital improvements
Depreciation and amortization
Income taxes
For a multifamily property with $500,000 in effective gross income and $200,000 in operating expenses, the NOI equals $300,000. Increasing NOI directly impacts property value and return metrics.
Capitalization Rate (Cap Rate)
The capitalization rate measures the relationship between a property's NOI and its purchase price, providing a snapshot of expected annual return independent of financing.
Cap Rate Formula: (Net Operating Income ÷ Purchase Price) × 100 = Cap Rate %
A property generating $300,000 NOI with an $4,000,000 purchase price delivers a 7.5% cap rate. This metric enables quick comparison across properties and markets.
Cap rates vary significantly by property type, location, and market conditions:
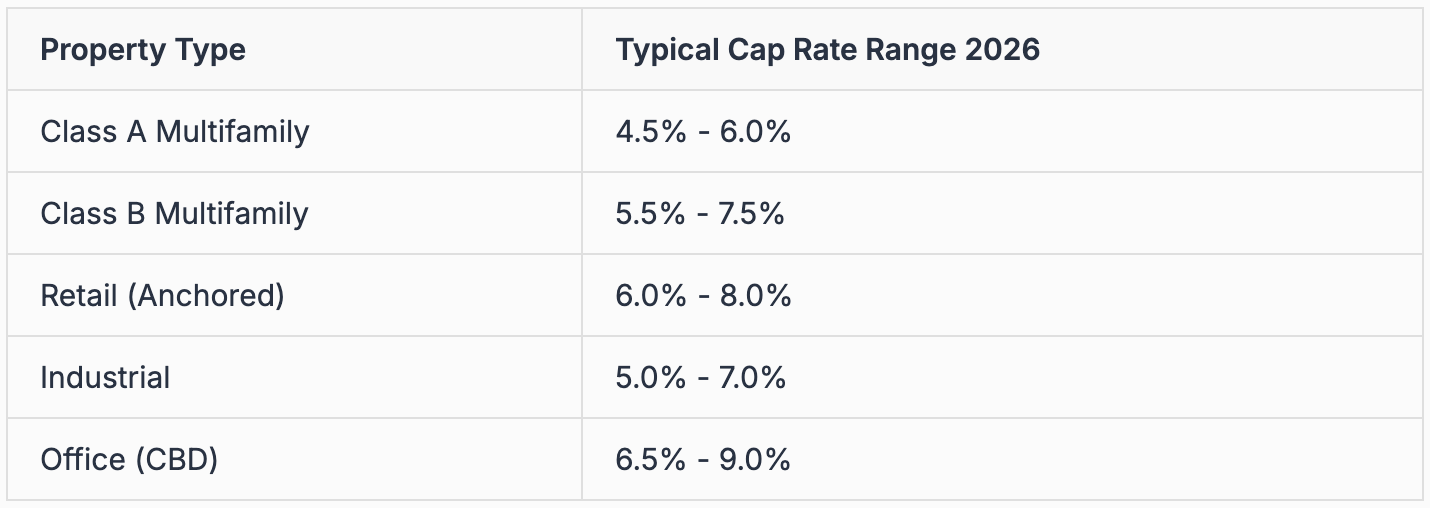
Lower cap rates indicate lower perceived risk and higher property values. Market research reveals local cap rate trends essential for competitive bidding.
Cash-on-Cash Return
While cap rate ignores financing, cash-on-cash return measures actual cash return on invested equity, accounting for mortgage payments.
Cash-on-Cash Formula: (Annual Pre-Tax Cash Flow ÷ Total Cash Invested) × 100 = Cash-on-Cash Return %
Using our previous example with 70% loan-to-value financing:
Purchase price: $4,000,000
Down payment: $1,200,000
Loan amount: $2,800,000 at 6.5% interest
Annual debt service: $224,000
NOI: $300,000
Annual cash flow: $76,000 ($300,000 NOI - $224,000 debt service)
Cash-on-cash return: 6.3% ($76,000 ÷ $1,200,000)
This metric reveals how leverage impacts actual returns to equity investors.
Debt Service Coverage Ratio (DSCR)
Lenders require properties to generate sufficient income to cover mortgage payments with a safety margin. The DSCR calculation determines whether a property qualifies for financing.
DSCR Formula: Net Operating Income ÷ Annual Debt Service = DSCR
For our example property: $300,000 NOI ÷ $224,000 debt service = 1.34 DSCR
Most commercial lenders require minimum DSCR between 1.20 and 1.35, depending on property type and market conditions. Higher ratios indicate stronger ability to weather income disruptions or expense increases.
Build a Comprehensive Pro Forma Model
Static metrics provide snapshots, but investment decisions require projections. A proper pro forma model forecasts property performance over your intended holding period, typically five to ten years.
Essential Pro Forma Components
Your model must project these elements annually:
Gross potential rent with market rent growth assumptions
Vacancy and credit loss based on historical performance and market conditions
Operating expense growth typically 2% to 3% annually
Capital expenditures for major systems and tenant improvements
Debt service including principal and interest payments
Exit assumptions including terminal cap rate and selling costs
The Redfin guide on evaluating investment properties emphasizes the importance of conservative assumptions in pro forma modeling.
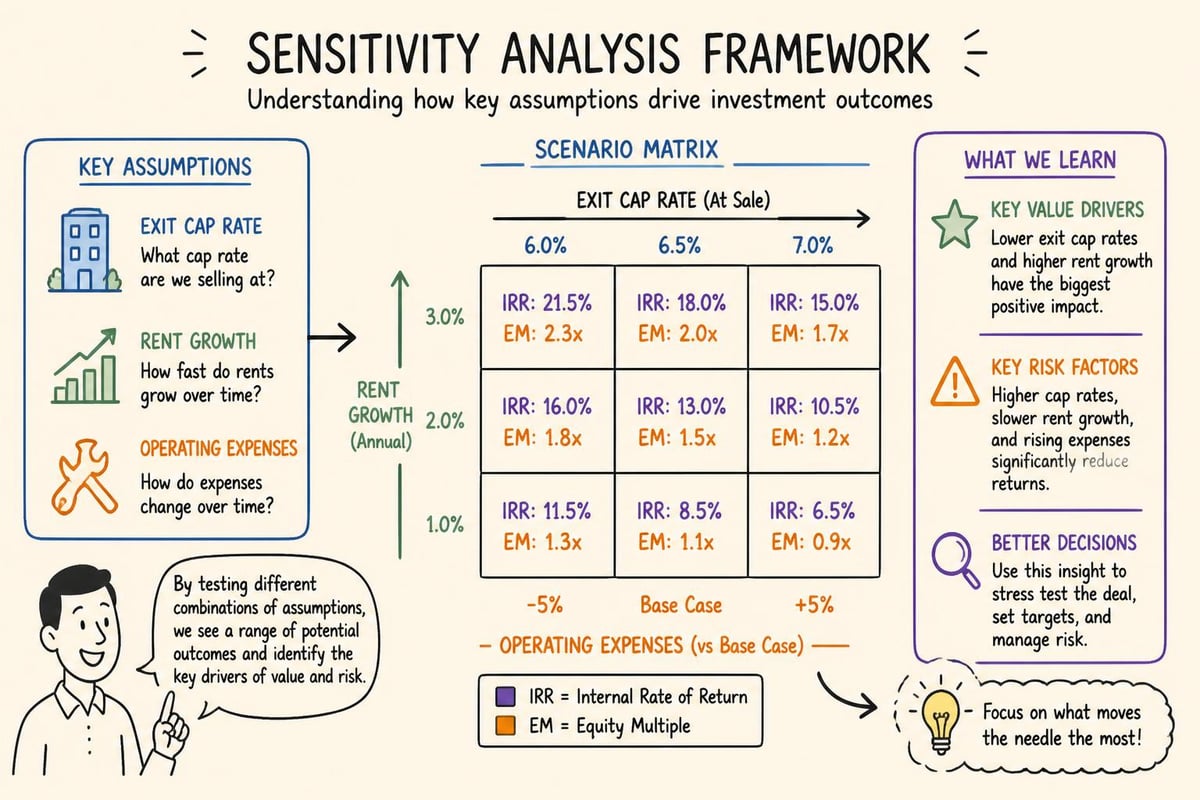
Sensitivity Analysis for Risk Assessment
Single-point forecasts ignore uncertainty. Professional analysis includes sensitivity tables showing how returns change across varying scenarios:
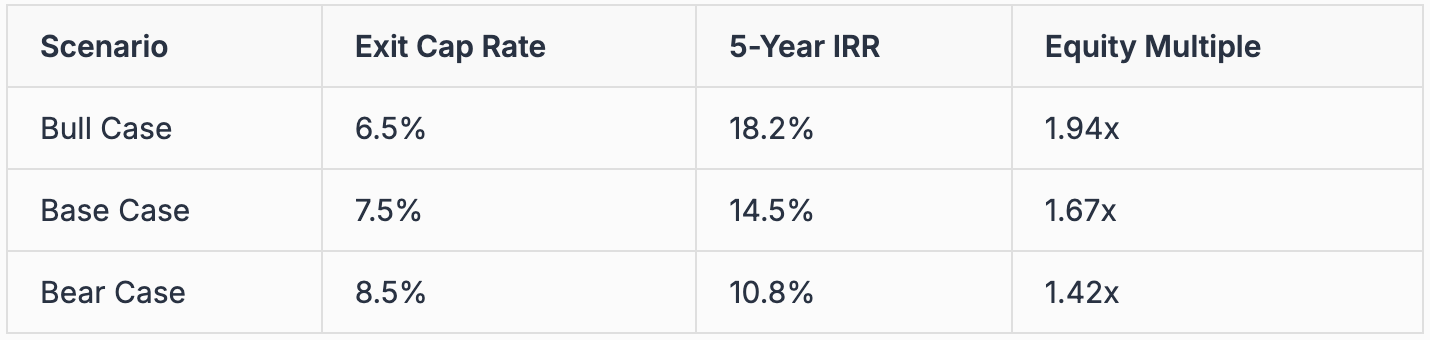
Test sensitivity across:
Exit cap rate (±50 to 100 basis points)
Rent growth (±1% annually)
Vacancy rate (±5% absolute)
Operating expense growth (±1% annually)
This analysis reveals which assumptions drive returns and where risks concentrate. According to Real Estate Insights, understanding these metrics through scenario planning separates sophisticated investors from those who rely on seller assumptions.
Conduct Market and Comparable Property Research
No property exists in isolation. Understanding how to analyze an investment property requires contextualizing it within its competitive market.
Identify True Comparable Properties
Effective comparable analysis matches properties across multiple dimensions:
Property type and class (don't compare Class A to Class C)
Location and submarket (walkability, employment centers, demographics)
Unit mix and amenities for multifamily
Tenant quality and lease terms for commercial
Transaction timing (sales within past 6 to 12 months)
Many investors rely on publicly available comparable sales, but these often lack crucial details like actual NOI, deferred maintenance, or special financing terms. The PropLab approach to analyzing real estate deals emphasizes verified comparables with complete financial data.
Market Trend Analysis
Beyond static comparables, analyze directional trends:
Rent growth trajectories over the past 36 months
Absorption rates and new supply pipeline
Employment and population growth in the submarket
Transaction volume and investor appetite
Tenant retention rates and lease renewal terms
Modern commercial real estate analytics platforms aggregate this data from multiple sources, providing source-linked verification for every data point.
Identify and Quantify Investment Risks
Every property carries risks that impact projected returns. Systematic risk assessment prevents surprises post-acquisition.
Property-Level Risks
Physical and operational risks specific to the asset:
Deferred maintenance requiring immediate capital deployment
Environmental issues like asbestos or soil contamination
Tenant concentration with single tenants representing over 20% of income
Near-term lease rollover requiring re-tenanting costs
Functional obsolescence reducing competitive position
Market and External Risks
Factors beyond property-level control:
Economic sensitivity to local employment changes
New competing supply under construction or planned
Regulatory changes affecting zoning or rent control
Interest rate exposure on floating-rate debt or refinancing
Exit market liquidity for the property type
Create a risk matrix scoring each factor on probability and impact. High-probability, high-impact risks require mitigation strategies or deal termination.
Evaluate Value-Add and Repositioning Opportunities
The best deals often involve properties trading below replacement cost with clear paths to operational improvement. Deal Run's analysis approach emphasizes identifying these opportunities systematically.
Common Value-Add Strategies
Revenue enhancement opportunities:
Below-market rents requiring systematic increases to market
Underutilized space convertible to income-producing areas
Fee income from parking, storage, or amenity charges
Service add-ons like high-speed internet or furnished units
Expense reduction opportunities:
Management inefficiencies correctable through better systems
Utility expense reduction through conservation measures
Insurance and tax appeal opportunities
Vendor contract renegotiation
Quantifying Value Creation
Calculate the impact of improvements on property value:
If implementing value-add strategies increases NOI by $50,000 annually, and the market cap rate is 7.0%, the value creation equals approximately $714,000 ($50,000 ÷ 0.07).
Factor implementation costs and timeline into your analysis:
Capital required for physical improvements
Lost income during renovation or lease-up
Professional fees for planning and execution
Financing costs for value-add capital
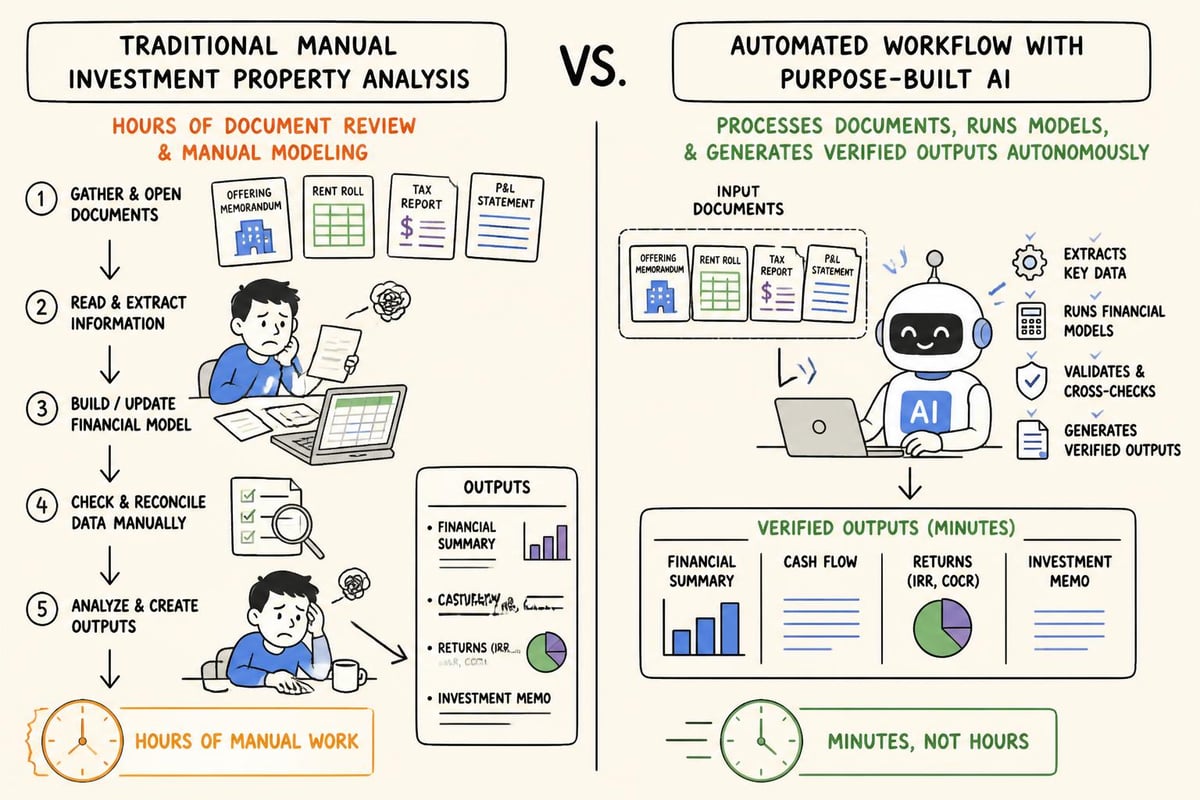
Automate Analysis Workflow with Purpose-Built Tools
Traditional analysis requires assembling data from multiple sources, manually building financial models, chasing down comparable properties, and hoping calculations tie out correctly. This process consumes 15 to 60 minutes for simple deals and days for complex portfolios.
The Limitations of Generic AI Tools
ChatGPT, Gemini, and similar general-purpose AI platforms offer brainstorming capabilities but fall short for investment analysis:
They require constant prompting and supervision
Outputs often contain calculation errors or unsourced assumptions
They cannot connect directly to property management systems
They lack verification links to source documents
They produce inconsistent results across similar queries
When evaluating multimillion-dollar investments, "almost right" equals wrong. The investment property analysis software landscape has evolved to address these limitations.
Purpose-Built Analysis Platforms
Leni represents a different approach: an AI analyst platform specifically designed for commercial real estate that runs complete analysis workflows autonomously. Rather than answering individual questions, it handles multi-step tasks from document upload through finished deliverables.
Key workflow capabilities:
Upload rent rolls, T12s, and offering memorandums in any format
Automatic data extraction with source linking for verification
Financial modeling and underwriting with sensitivity analysis
Market comparable research with verifiable source links
Investment committee memo and presentation creation
Direct integration with Yardi, RealPage, and Entrata systems
The platform runs autonomously for 15 to 60 minutes per property, returning completed analysis you can verify and defend. SOC 2 Type 2 certification ensures data security for institutional workflows.
Accuracy Standards That Matter
Generic AI platforms often produce plausible-sounding outputs that don't withstand scrutiny. Leni achieved 98% accuracy on BullshitBench (ranked first among tested platforms), demonstrating consistent reliability on factual analysis tasks.
More importantly, every output includes direct links to source documents, enabling verification of every assumption and calculation. This transparency matters when presenting to investment committees or lenders who demand defensible analysis.
Structure Investment Committee Recommendations
Analysis exists to drive decisions. The final deliverable must communicate findings clearly to stakeholders with varying technical backgrounds.
Essential IC Memo Components
Investment committee memorandums should include:
Executive summary with deal thesis and recommendation
Property overview including location, specifications, and tenant details
Market analysis with comparable sales and trend data
Financial projections showing base case and sensitivity scenarios
Risk assessment identifying key concerns and mitigation strategies
Value creation plan detailing operational improvements
Investment metrics summary with returns across scenarios
Recommendation with specific conditions or contingencies
The investment memo creation process traditionally requires assembling insights from multiple analyses into coherent narratives, a time-consuming task that delays decision-making.
Visual Communication for Complex Analysis
Numbers alone rarely persuade. Effective presentations combine data with clear visual communication:
Waterfall charts showing sources and uses of capital
Sensitivity tables highlighting return ranges
Market maps positioning the property against competitors
Timeline graphics illustrating value-add implementation
Comparison matrices evaluating this opportunity against alternatives
Professional presentations reflect analytical rigor and build confidence in recommendations.
Execute Due Diligence with Systematic Verification
Preliminary analysis identifies whether to proceed with an offer. Due diligence confirms whether to close.
Due Diligence Checklist by Category
Financial verification:
Audit actual rent collections against reported figures
Review three years of tax returns and audited financials
Verify tenant security deposits held in escrow
Confirm all utility accounts and payment history
Review capital expenditure records for deferred items
Legal and regulatory:
Title review identifying encumbrances or easements
Zoning compliance and any non-conforming uses
Review all leases for unusual provisions or tenant rights
Verify property tax assessments and pending appeals
Environmental Phase I (and Phase II if triggered)
Physical inspection:
Professional property condition assessment
Major systems review (HVAC, roofing, electrical, plumbing)
Life safety systems compliance (fire suppression, egress)
ADA compliance for common areas
Seismic or flood risk assessment where applicable
According to Lineage's evaluation framework, systematic due diligence prevents costly surprises that undermine projected returns.
Document Your Findings and Negotiations
Due diligence almost always reveals discrepancies requiring seller resolution:
Deferred maintenance requiring credits or escrow holdbacks
Rent roll discrepancies requiring lease file verification
Environmental concerns requiring remediation or price adjustment
Legal issues requiring seller cure before closing
Document all findings in detail. Quantify financial impacts. Present clear resolution requirements with supporting evidence. Strong documentation enables effective negotiation and protects against post-closing disputes.
Knowing how to analyze an investment property separates successful acquisitions from expensive mistakes, but the traditional workflow wastes time and introduces errors that compound throughout underwriting. Leni eliminates these inefficiencies by running the complete analysis workflow autonomously, from document extraction through financial modeling, market research, and IC memo creation, all with verifiable source links you can defend. Upload your next deal's documents and let Leni handle the analytical heavy lifting while you focus on sourcing and negotiating.

Johanna Gruber
Johanna has spent the last 8 years helping marketing teams connect with audiences through content. Specializing in B2B SaaS and real estate.
Curious About AI?
Join the largest AI community for real estate online. Get bite-sized, real-world use case videos, plus practical tips and proven strategies from top industry experts on adopting AI effectively.
MEET LENI
AI SuperAgent Purpose Built for Investors and Operators.
Experience how professionals and teams in your domain are getting the edge using AI.