AI Data Visualization for CRE: Purpose-Built vs Generic

AI Data Visualization for CRE: Purpose-Built vs Generic
Most commercial real estate asset managers know exactly what happened last quarter. Occupancy dropped 3%, NOI declined $120,000, and two leases expired without renewal. The dashboards confirm it with colorful charts and trend lines. What those same dashboards fail to answer is the question that actually matters: what should you do about it? This gap between retrospective reporting and forward-looking action defines the fundamental limitation of traditional data visualization in CRE. The industry has reached a turning point where AI is transforming data visualization techniques across sectors, but the question for asset management teams isn't whether to adopt AI data visualization, it's which approach actually drives decisions rather than just documenting history.
The Retrospective Problem: Why Traditional Dashboards Fall Short in Asset Management
Asset managers operate in a workflow where speed and accuracy determine deal outcomes and portfolio performance. Traditional business intelligence tools like Power BI and Tableau deliver sophisticated visualization capabilities, but they weren't designed with the unique complexity of commercial real estate in mind.
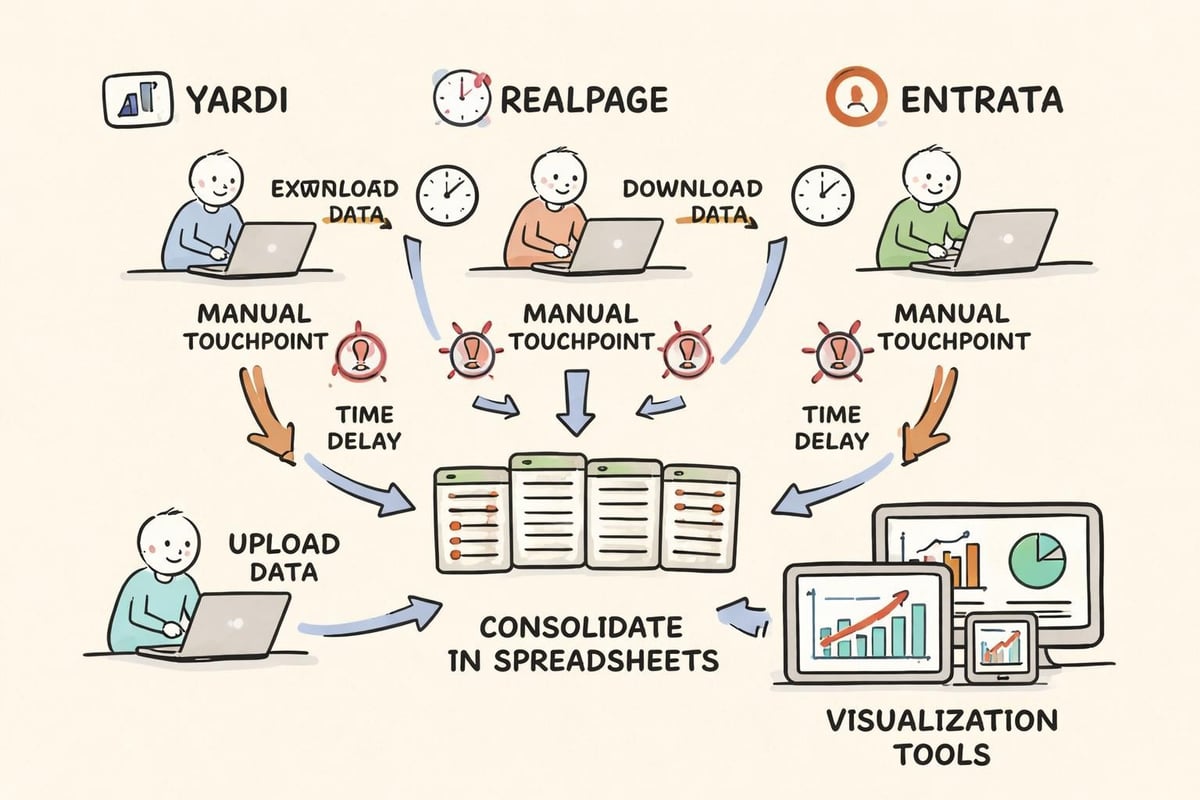
The fundamental issue is data fragmentation. CRE portfolios generate information across multiple disconnected systems: property management platforms (Yardi, RealPage, Entrata, AppFolio), accounting software, leasing databases, market research subscriptions, and capital expenditure tracking tools. Generic visualization platforms require extensive manual data consolidation before a single chart appears on screen.
The typical workflow reveals the inefficiency:
Export data from property management systems (often manually)
Clean and standardize formats across properties
Upload to visualization tool
Build custom dashboards with CRE-specific metrics
Refresh data periodically (weekly or monthly)
Distribute static reports to stakeholders
This process transforms what should be real-time insights into historical documentation. By the time an asset manager reviews last month's performance metrics, market conditions have shifted and the opportunity to intervene has narrowed.
The Customization Tax: Time Cost of Adapting Generic Tools
Power BI and Tableau excel at general business analytics, but CRE metrics require significant customization. Key asset management metrics like economic occupancy, rent roll variance, tenant improvement reserves, and capital call projections don't exist as pre-built templates.
Asset management teams face a choice: invest hundreds of hours building custom dashboards or settle for generic metrics that miss CRE nuances. Most firms compromise, creating partial visualizations that answer some questions while leaving critical analyses in spreadsheets.
The customization burden extends beyond initial setup. As portfolios evolve, property types change, or investment strategies shift, dashboards require reconfiguration. A team managing multifamily properties that acquires industrial assets must rebuild substantial portions of their visualization infrastructure to accommodate different lease structures, operating metrics, and market comparables.
ChallengePower BI/Tableau ApproachPurpose-Built CRE AI PlatformData IntegrationManual exports and uploadsDirect API connections to PM systemsMetric ConfigurationCustom formulas per dashboardPre-built CRE calculationsUpdate FrequencyScheduled refreshesReal-time monitoringActionable InsightsUser interprets chartsAI identifies anomalies and recommendationsSource VerificationLink to aggregated dataDirect links to source documents
AI Data Visualization for CRE: Two Distinct Approaches
The commercial real estate industry has begun adopting ai data visualization, but not all implementations deliver equal value. Understanding the distinction between adapted generic tools and purpose-built platforms determines whether visualization accelerates or merely documents portfolio management.
Approach One: AI-Enhanced Generic Tools
The first approach layers AI capabilities onto existing business intelligence platforms. Power BI's AI features include anomaly detection, forecasting algorithms, and natural language queries. Tableau offers similar enhancements through Einstein Discovery and Ask Data features.
These additions provide value in specific scenarios:
Automated outlier detection in occupancy trends
Predictive modeling for revenue forecasting
Natural language chart generation
Automated insight summaries
However, the fundamental architecture remains unchanged. These tools still require manual data integration from property management systems. The AI analyzes whatever data users upload, but it doesn't understand CRE context without extensive training on industry-specific patterns.
An asset manager might ask Power BI's AI to "show properties with declining NOI," but the system can't automatically pull lease expiration schedules, assess market rent comparables, or recommend specific intervention strategies without substantial custom development. The visualization shows trends; the asset manager must connect those trends to actionable decisions through separate analysis.
Approach Two: Purpose-Built CRE AI Platforms
Purpose-built ai data visualization platforms like Leni's reporting and asset management capabilities integrate data extraction, analysis, and visualization into unified workflows designed specifically for commercial real estate operations.
The architectural difference fundamentally changes what's possible. Rather than starting with visualization and working backward to data sources, these platforms begin with direct connections to property management systems and build forward to insights.
Key differentiators include:
Native PMS Integration: Direct API connections to Yardi, RealPage, Entrata, and AppFolio eliminate manual data exports
CRE-Specific Intelligence: Pre-trained models understand lease structures, operating expense categories, and market dynamics
Autonomous Analysis: AI runs multi-step analytical tasks without constant user direction
Source-Linked Outputs: Every metric traces back to specific source documents for verification
Threshold-Based Monitoring: Automated alerts when KPIs cross defined parameters
This approach recognizes that effective ai data visualization in CRE isn't about creating prettier charts. It's about automating the analytical work between data collection and decision-making.
Live Data vs. Static Snapshots: The Integration Advantage
The frequency and freshness of data updates separate tactical visualization from strategic intelligence. Generic tools operate on refresh cycles: daily, weekly, or monthly depending on how frequently teams manually update source data. Purpose-built platforms operate continuously, monitoring property performance in near real-time.
Consider a practical scenario that asset managers face regularly. A tenant provides notice of non-renewal 120 days before lease expiration. This information enters the property management system immediately, but when does it surface in performance dashboards?
Generic Tool Workflow:
Tenant notice entered in Yardi (Day 0)
Monthly data export scheduled (Day 30)
Dashboard updated with new occupancy projection (Day 30)
Asset manager reviews during monthly meeting (Day 35)
Team initiates leasing strategy (Day 40+)
Integrated AI Platform Workflow:
Tenant notice entered in Yardi (Day 0)
AI detects change via direct integration (Day 0)
Automated analysis of market rent, replacement timeline, and NOI impact (Day 0)
Pulse alert delivered to asset manager with recommendations (Day 1)
Team reviews AI-generated leasing analysis and market comps (Day 2)
Leasing strategy initiated (Day 3)
The difference isn't merely speed. The integrated approach allows the AI agent for real estate to immediately contextualize the lease expiration against current market conditions, historical leasing velocity, and portfolio-wide occupancy targets. Generic tools can eventually show the same historical occupancy change, but they can't autonomously analyze implications or recommend responses.
The Verification Imperative: Source-Linked Outputs
SOC 2 Type 2 certification and institutional-grade decision-making require verifiable data lineage. Asset managers presenting to investment committees or limited partners must substantiate every metric and analysis with traceable source documentation.
Traditional ai data visualization tools aggregate data into summary metrics and charts. When stakeholders question a specific number, users must manually locate source documents, cross-reference against the visualization, and validate accuracy. This verification burden undermines confidence in AI-generated insights.
Purpose-built platforms address this through automated source linking. Every visualization element connects directly to the underlying data point: the specific lease clause, rent roll entry, invoice, or market report that generated the metric. Asset managers click through visualizations to source documents in seconds rather than hours.
This architectural difference becomes critical during financial modeling and underwriting processes where acquisition committees require complete transparency into assumption sources and calculation methodologies.
RequirementGeneric Visualization ToolsPurpose-Built CRE AIMetric TraceabilityManual source lookupOne-click source accessAudit TrailLimited to data uploadsComplete lineage trackingIC Memo SupportExport charts separatelyIntegrated memo generation with embedded sourcesAssumption DocumentationManual annotationAutomated assumption capture and linking
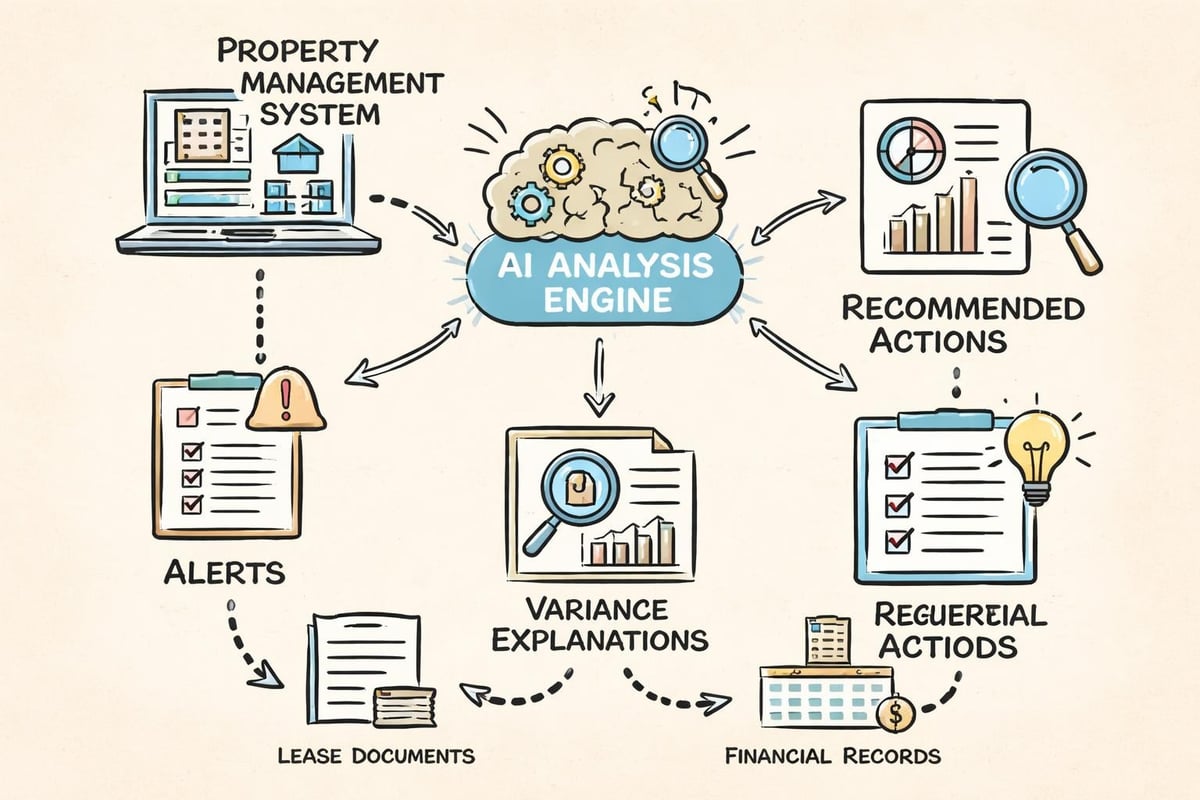
Beyond Charts: AI Data Visualization as Analytical Workflow
The evolution from static reporting to dynamic intelligence requires rethinking what visualization means in asset management contexts. Data analysis tools increasingly combine display, interpretation, and recommendation into unified experiences.
Advanced ai data visualization in CRE doesn't just show occupancy trends across a portfolio. It identifies which properties deviate from expected patterns, explains potential causes by analyzing lease expirations and local market conditions, and suggests specific interventions based on historical performance of similar assets.
Comprehensive analytical workflows incorporate:
Variance Analysis: Automatic comparison of actual vs. budgeted performance with AI-generated explanations
Peer Benchmarking: Portfolio-wide comparative metrics highlighting outlier properties
Predictive Indicators: Forward-looking projections based on lease schedules and market trends
Action Recommendations: Specific suggested interventions tied to performance gaps
Document Generation: Automated creation of asset management reports and IC memos
Platforms like Leni exemplify this integrated approach, where visualization serves as the interface to comprehensive analytical capabilities rather than the end product itself. Asset managers don't simply view charts; they interact with an AI analyst that uses visualization to communicate findings from deep portfolio analysis.
Workflow Automation: From Insight to Action
The most sophisticated ai data visualization implementations extend beyond analysis into execution. Research on AI in advancing data visualization highlights how modern systems increasingly automate not just data presentation but entire analytical workflows.
In CRE asset management, this translates to automated processes that trigger based on visualization thresholds. When occupancy drops below a defined percentage, the system doesn't just display a red indicator. It automatically generates a leasing analysis, pulls comparable market data, drafts outreach materials for brokers, and schedules follow-up tasks for the asset management team.
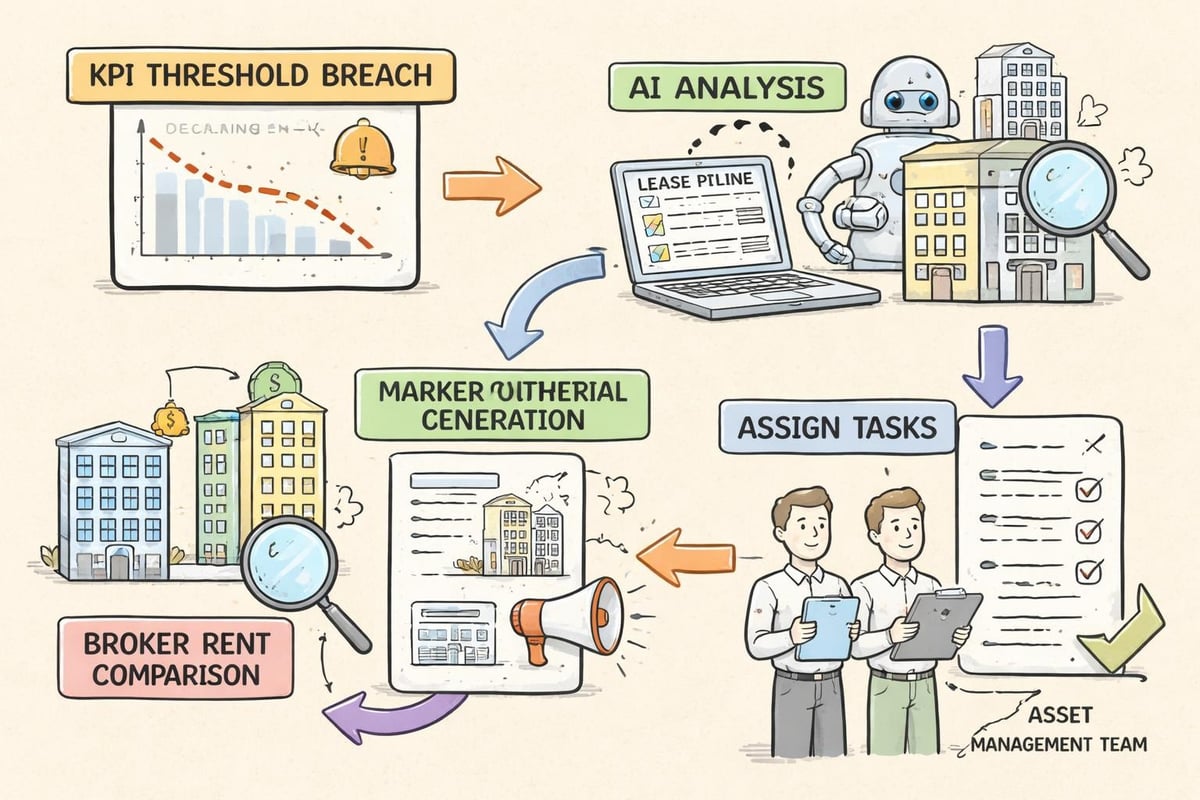
This level of integration requires purpose-built architecture that understands CRE operations, not generic visualization tools adapted through extensive customization. The difference determines whether ai data visualization accelerates portfolio performance or merely documents it with more sophisticated graphics.
The Decision Framework: Evaluating AI Data Visualization for CRE
Asset managers evaluating visualization platforms should apply a structured framework that prioritizes operational impact over feature lists. The goal isn't selecting the tool with the most chart types, but identifying the platform that most effectively transforms data into decisions.
Integration Depth Assessment
Critical Questions:
Does the platform connect directly to our property management systems via API?
Can it access data from Yardi, RealPage, Entrata, or AppFolio without manual exports?
How frequently does data refresh: on-demand, hourly, daily, or manual?
Does integration require custom development or come pre-configured for CRE?
Platforms that require manual data uploads, regardless of their AI capabilities, introduce delays and potential errors that undermine real-time decision-making. Real estate analytics companies increasingly differentiate themselves through integration depth rather than visualization sophistication.
CRE-Specific Intelligence Evaluation
Generic business intelligence tools don't understand that "rent" in a commercial lease includes base rent, percentage rent, and expense reimbursements. They don't automatically calculate economic occupancy differently from physical occupancy. They can't interpret CAM reconciliations or assess whether tenant improvement allowances align with market standards.
Evaluation Criteria:
Pre-built calculations for CRE metrics (NOI, cap rates, debt service coverage, economic occupancy)
Understanding of lease structures across property types
Market comparable integration for rent and valuation analysis
Capital expenditure tracking and reserve analysis
Tenant credit assessment and rent collection monitoring
The more CRE-specific intelligence embedded in the platform, the less customization required and the faster teams achieve value from ai data visualization implementations.
Source Verification Capabilities
Investment committees don't approve acquisitions based on charts without substantiation. Limited partners don't accept performance reports that can't trace back to source documents. Investment memos and presentations require complete data lineage.
Evaluate how platforms handle source linking:
Can users click through visualizations to underlying documents?
Are assumptions and calculations automatically documented?
Does the system maintain audit trails showing data transformations?
Can reports include embedded source links for stakeholder review?
Platforms that treat visualization as isolated from documentation create additional work during critical decision processes. Integrated systems that combine analysis, visualization, and source linking eliminate this friction.
Autonomous Analysis vs. User-Directed Queries
The spectrum of ai data visualization ranges from tools that answer specific user questions to platforms that autonomously identify issues requiring attention. Both approaches have value, but they serve different operational models.
User-Directed Model:
Asset manager asks: "Which properties have the highest maintenance costs?"
System generates relevant visualization
Manager interprets results and decides next steps
Autonomous Model:
System continuously monitors all properties
AI identifies Property A with maintenance costs 40% above comparable assets
Platform analyzes specific cost categories, vendor patterns, and historical trends
Manager receives alert with analysis and recommended investigations
The autonomous approach scales more effectively across large portfolios where asset managers can't manually query every potential issue. As explored in AI-powered data visualization automation, modern platforms increasingly emphasize proactive insight delivery over reactive query response.
Evaluation FactorWeightGeneric Tools ScorePurpose-Built CRE AI ScorePMS Integration DepthHigh2/5 (manual exports)5/5 (direct API)CRE Metric LibraryHigh2/5 (requires customization)5/5 (pre-built)Update FrequencyMedium3/5 (scheduled)5/5 (real-time)Source VerificationHigh2/5 (manual lookup)5/5 (automated linking)Autonomous InsightsMedium3/5 (limited)5/5 (comprehensive)Implementation TimeMedium2/5 (months of customization)4/5 (weeks to full deployment)
Cost-Benefit Analysis: TCO Beyond Licensing
Software licensing represents only a fraction of total cost of ownership for ai data visualization implementations. Asset management teams must account for implementation time, ongoing customization, training requirements, and opportunity costs of delayed insights.
Generic Tool TCO Components:
Base licensing fees
Implementation consulting (often 3-6 months)
Custom dashboard development
Ongoing data integration maintenance
Training for each user and use case update
IT resources for system administration
Purpose-Built Platform TCO Components:
Platform subscription (typically higher per-user than generic tools)
Onboarding and initial configuration (often 2-4 weeks)
Training on CRE-specific features
Ongoing support and feature updates
The critical comparison isn't monthly cost per user, but total investment required to achieve operational value. A platform that costs 3x more per seat but delivers insights in one month versus six months often delivers superior ROI, particularly for asset management teams where timing impacts portfolio performance.
Additionally, consider the opportunity cost of delayed decision-making. In competitive acquisition environments or during market dislocations like the multifamily investment outlook 2026 presents, faster access to verified insights creates measurable competitive advantage.
Implementation Considerations for Enterprise Asset Management Teams
Enterprise teams managing diverse portfolios across multiple property types and geographies face unique ai data visualization requirements. The platform must accommodate complexity without sacrificing usability.
Multi-Property Type Support
Asset managers rarely specialize in single property types exclusively. Portfolios commonly mix multifamily, office, retail, and industrial assets. Each category generates distinct metrics, lease structures, and market dynamics.
Generic visualization tools require separate dashboard configurations for each property type. Changes to one configuration don't transfer to others. Teams essentially maintain parallel visualization environments within a single platform.
Purpose-built CRE platforms understand these differences inherently. The same system that analyzes multifamily rent rolls automatically adjusts for retail percentage rent and office tenant improvement amortization. Visualization adapts to property type without manual reconfiguration.
Geographic Market Intelligence
Portfolio performance exists in market context. A 5% occupancy decline in a market with 3% average vacancy signals crisis. The same decline in a market with 8% vacancy may represent relative outperformance.
Effective ai data visualization integrates market research directly into portfolio monitoring. Rather than requiring asset managers to separately research market conditions and manually contextualize property performance, integrated platforms automatically compare portfolio metrics against relevant market benchmarks.
This integration becomes particularly valuable during rapid market shifts where yesterday's performance standards no longer apply. The platform that automatically updates market context delivers more accurate insight than systems relying on manually updated benchmarks.
Scalability Across Portfolio Growth
Asset management platforms must accommodate both current portfolio size and anticipated growth. A tool that works efficiently for 20 properties may become unwieldy at 200 properties.
Scalability Indicators:
Performance with large datasets (10,000+ units)
User interface responsiveness across portfolio sizes
Ability to drill down from portfolio to property to unit level
Search and filtering capabilities for rapid navigation
Automated organization and categorization of properties
Platforms built specifically for institutional asset management incorporate scalability from initial architecture rather than attempting to retrofit it as portfolios grow.
Competitive Positioning: Speed to Insight as Differentiator
Commercial real estate operates in increasingly competitive markets where information advantages create value capture opportunities. The firm that identifies underperforming assets first, recognizes market shifts earliest, or underwrites acquisitions most accurately wins.
Traditional visualization tools democratize access to historical data. Every firm can eventually produce similar dashboards showing what happened last quarter. Competitive advantage emerges from platforms that deliver forward-looking insights before competitors recognize the same patterns.
Purpose-built ai data visualization platforms like Leni create this advantage through several mechanisms:
Continuous Monitoring: Real-time integration means insights surface immediately rather than waiting for next reporting cycle
Autonomous Analysis: AI identifies patterns and anomalies without requiring asset managers to know which questions to ask
Contextual Intelligence: Platform understands CRE operations and market dynamics, connecting data points that generic tools miss
Verified Recommendations: Source-linked analysis enables faster decision-making with confidence in data accuracy
The competitive moat isn't the visualization itself, but the speed of the analytical workflow from data to decision. Firms that compress this cycle outperform competitors working with the same underlying market data.
The choice between generic business intelligence tools and purpose-built ai data visualization platforms fundamentally shapes how asset management teams operate. While tools like Power BI and Tableau offer extensive customization potential, the time and resources required to adapt them for CRE workflows often exceed the operational benefits they deliver. Purpose-built platforms that combine direct property management system integration, CRE-specific intelligence, and autonomous analysis transform visualization from retrospective reporting into forward-looking strategic intelligence. Leni delivers exactly this integrated approach, connecting directly to Yardi, RealPage, Entrata, and AppFolio to monitor portfolio performance in real-time, generating threshold-based alerts and source-verified insights that drive immediate action rather than documenting history.

Johanna Gruber
Johanna has spent the last 8 years helping marketing teams connect with audiences through content. Specializing in B2B SaaS and real estate.
Curious About AI?
Join the largest AI community for real estate online. Get bite-sized, real-world use case videos, plus practical tips and proven strategies from top industry experts on adopting AI effectively.
MEET LENI
AI SuperAgent Purpose Built for Investors and Operators.
Experience how professionals and teams in your domain are getting the edge using AI.