AI for Reporting in Real Estate: Transform Portfolio Ops

AI for Reporting in Real Estate: Transform Portfolio Ops
Asset managers and portfolio operators know the reality: reporting consumes entire days each month. Manual data extraction from Yardi or RealPage, reconciling budget variances, calculating NOI by property, tracking delinquencies across aging buckets, and formatting investor-ready narratives before deadlines. The shift to ai for reporting in real estate isn't about replacing spreadsheets with chatbots. It's about deploying purpose-built systems that understand commercial real estate operating metrics without requiring custom configuration, connect directly to property management platforms, and deliver verifiable outputs with source links.
What AI Reporting Tools Exist for Real Estate
AI reporting platforms designed specifically for commercial real estate differ fundamentally from generic business intelligence tools. These systems understand the unique data structures of property management systems, recognize metrics like NOI variance and occupancy trends, and generate outputs formatted for institutional stakeholders.
Purpose-Built vs. Generic Analytics
Traditional BI platforms require extensive configuration to handle commercial real estate data. You map fields, build custom calculations for metrics like economic occupancy, and create templates for each report type. AI for reporting in real estate eliminates this setup phase by arriving pre-trained on CRE concepts.
Key differences include:
Native understanding of lease expirations, rent rolls, and CAM reconciliations
Pre-configured calculations for NOI, debt service coverage, and cash-on-cash returns
Automatic recognition of aging buckets for accounts receivable without manual categorization
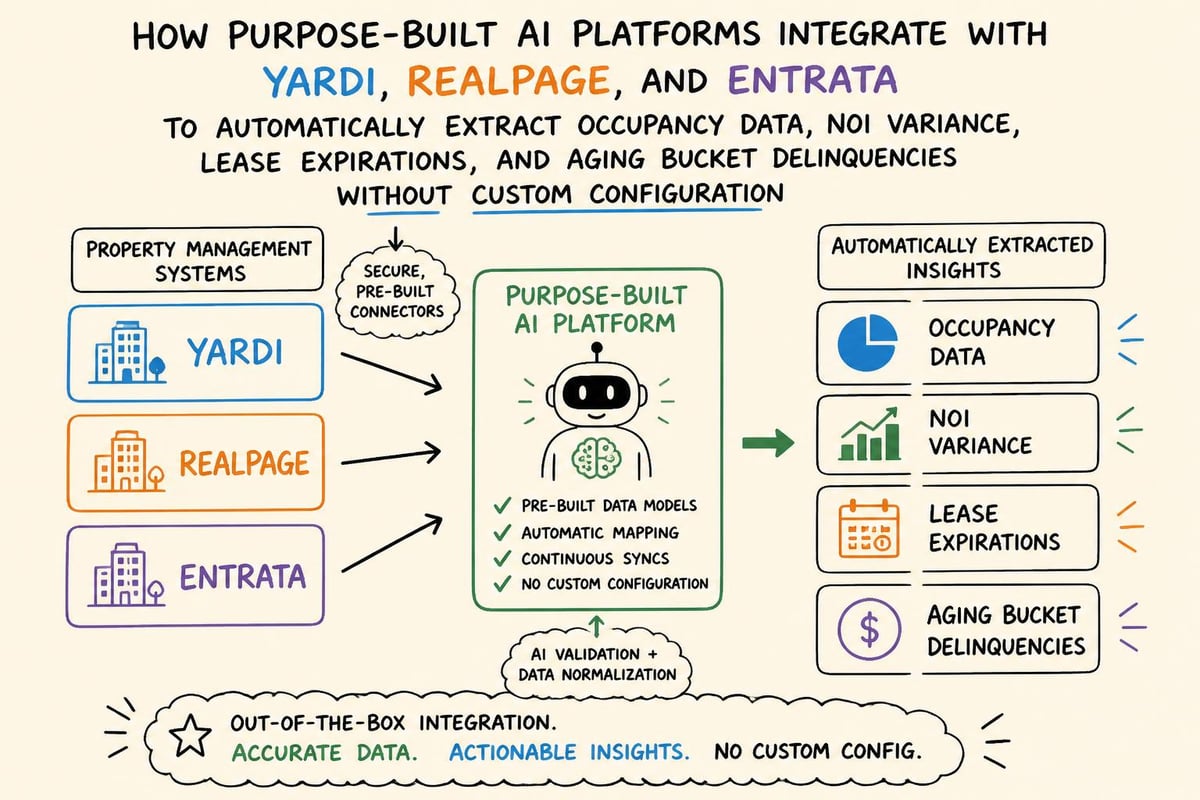
Direct integration with Yardi, RealPage, and Entrata through API connections
AI-powered platforms for property analysis demonstrate how specialized tools outperform generic solutions when handling real estate-specific workflows.
The institutional-grade approach requires SOC 2 Type 2 certification for data security. When connecting to property management systems containing tenant payment histories, lease agreements, and financial performance data, security cannot be an afterthought. Purpose-built platforms designed for asset managers maintain compliance standards that general AI tools typically lack.
Weekly Reporting Cycle: With and Without AI
Asset managers track portfolio performance on predictable schedules. Weekly reports focus on operational metrics that require immediate attention: new delinquencies, move-ins and move-outs, maintenance spend, and occupancy changes.
Manual Weekly Process
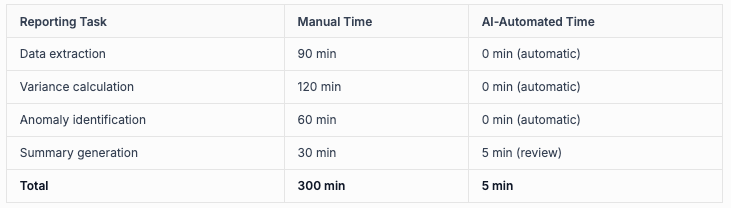
Without AI, the weekly cycle begins Monday morning. You log into your property management system, export occupancy reports for each property, copy data into Excel templates, calculate week-over-week changes, identify properties with declining metrics, and draft email summaries for your team. This process consumes 4-6 hours weekly across a 15-property portfolio.
Time allocation breaks down as:
Data extraction from PMS: 90 minutes
Spreadsheet compilation and calculations: 120 minutes
Variance identification and analysis: 60 minutes
Summary drafting and distribution: 30 minutes
AI-Automated Weekly Workflow
With AI for reporting in real estate, the same cycle operates autonomously. The platform connects to your property management system overnight, extracts current occupancy and collections data, compares metrics against prior week baselines, identifies variances exceeding your defined thresholds, and generates written summaries explaining the changes.
The critical advancement involves threshold-based alerting. Rather than waiting for scheduled reports, the AI flags anomalies immediately when they occur. A property that typically maintains 94% occupancy drops to 89% mid-week? You receive an alert before your standard Friday report, allowing you to investigate lease-up issues or competitive pressure in real-time.
For teams managing portfolio reporting and asset management, this shift from reactive to proactive monitoring changes how quickly problems get addressed.
Monthly Performance Reports and Budget Variance
Monthly reporting expands beyond operational metrics to financial performance. Asset managers compare actual results against underwritten budgets, explain variances to investors, and adjust forecasts based on emerging trends.
Budget vs. Actual Analysis
The monthly close process requires reconciling dozens of line items across multiple properties. Revenue categories (base rent, parking, late fees, other income), operating expense buckets (payroll, repairs and maintenance, utilities, property management fees), and capital expenditures all need comparison against budget with variance explanations.
Standard variance table format:
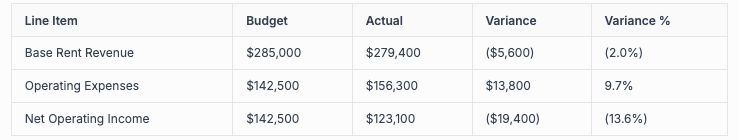
Without AI, you spend hours building these tables, then additional hours writing explanatory narratives. "Operating expenses exceeded budget by 9.7% primarily due to unplanned HVAC repairs at Building A ($8,200) and higher snow removal costs in January ($4,100)."
Automated Narrative Generation
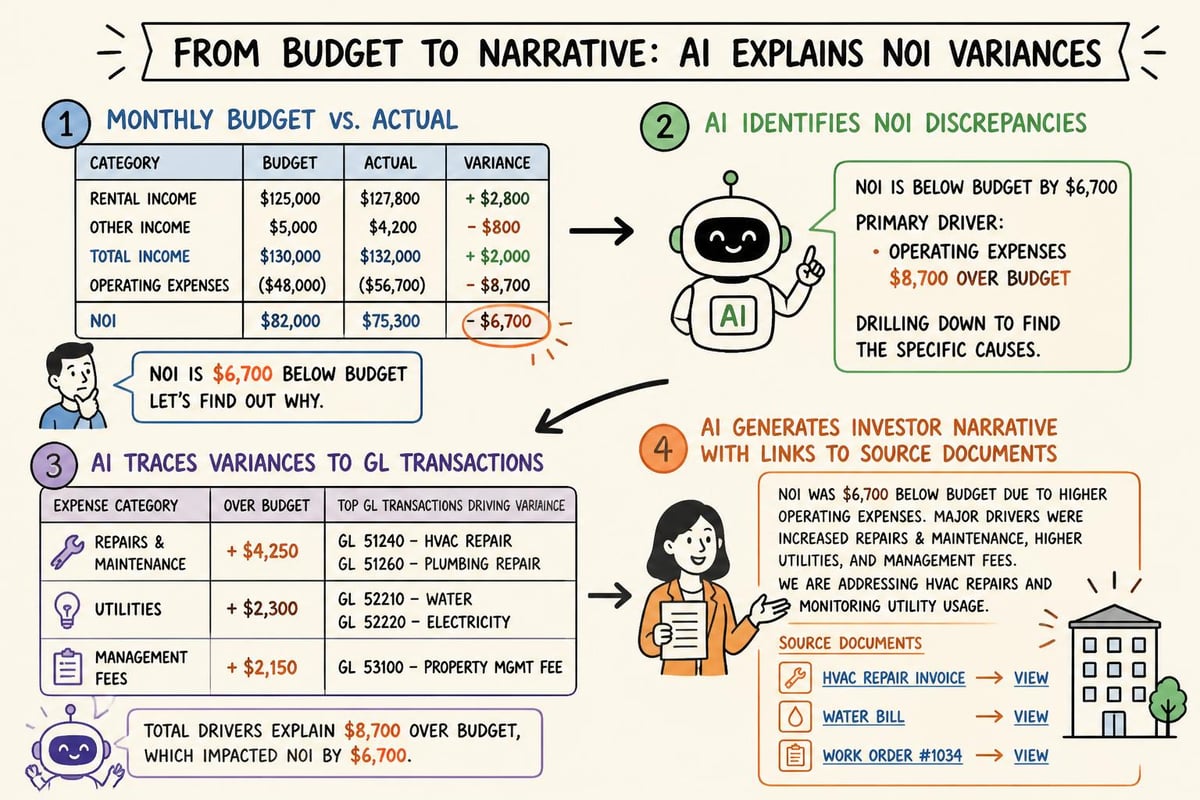
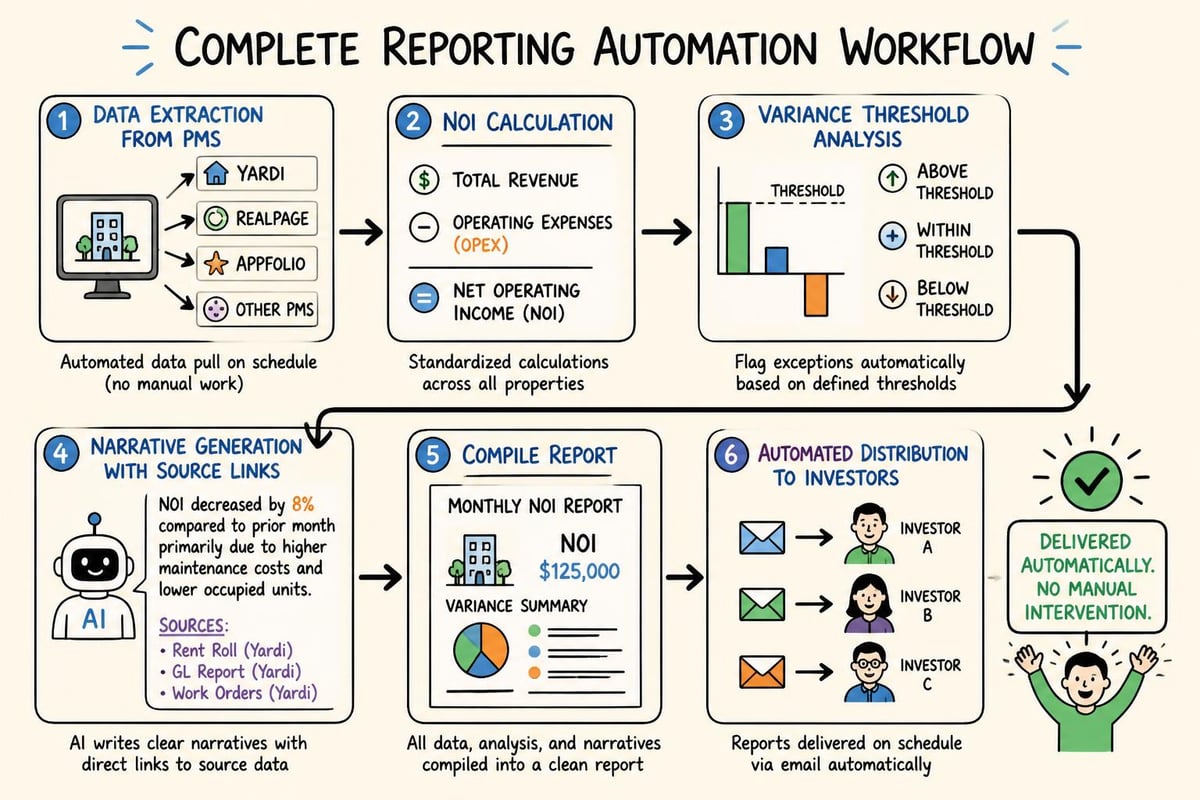
AI for reporting in real estate transforms this workflow by generating investor-ready narratives directly from property management system data. The platform identifies which variances exceed materiality thresholds (typically 5% or 10%), traces the specific transactions causing those variances, and writes explanations referencing the source documents.
The output includes direct links to source data: the specific work orders for HVAC repairs, the vendor invoices for snow removal, and the GL codes where expenses posted. This verifiability matters enormously when investors question your numbers or auditors request documentation during year-end reviews.
Tools that enhance data analytics in asset management demonstrate how automated variance analysis reduces reporting time while increasing accuracy.
Delinquency Reporting by Aging Bucket
Collections management requires constant visibility into accounts receivable aging. Asset managers need to know which tenants are 30, 60, or 90+ days past due, how delinquency levels compare to historical norms, and whether specific properties show concerning trends.
Aging Bucket Categorization
Property management systems track receivables, but extracting meaningful insights requires manual analysis. You export AR aging reports, categorize balances into buckets (current, 1-30 days, 31-60 days, 61-90 days, 90+ days), calculate delinquency rates as a percentage of potential rent, and identify tenants requiring immediate collection action.
Weekly delinquency tracking involves:
Exporting AR aging reports from each property
Consolidating data across portfolio
Calculating percentage delinquent by property and portfolio-wide
Identifying new delinquencies and resolved accounts
Flagging tenants transitioning to later aging buckets
This process reveals critical patterns. A tenant currently in the 31-60 day bucket represents a different urgency level than one already 90+ days past due. Movement between buckets signals whether collection efforts are working or problems are escalating.
AI-Powered Collections Intelligence
AI for reporting in real estate automates aging bucket analysis while adding predictive intelligence. The platform tracks not just current delinquency status but historical payment patterns for each tenant. A tenant who typically pays by the 5th but is now 15 days late receives different treatment than one with chronic late payment history.
The system generates delinquency reports showing:
Current aging bucket distribution with week-over-week changes
Tenants who moved to later aging buckets since last report
Properties with delinquency rates exceeding portfolio averages
Predicted probability of collection based on historical patterns
This intelligence becomes more accurate as the platform ingests more data. Six months of payment history provides basic insights. Two years of data across a full portfolio enables the AI to recognize seasonal patterns, identify tenant industries with higher default risk, and flag early warning signs before accounts reach 90+ days past due.
Real estate AI tools designed for commercial property management excel at pattern recognition across large datasets that would take analysts weeks to identify manually.
Quarterly Investor Reporting and IC Updates
Quarterly reports serve different audiences than weekly or monthly outputs. These comprehensive packages go to limited partners, investment committees, and senior leadership. They require polished formatting, executive summaries, market context, and forward-looking projections.
Manual Quarterly Report Compilation
Building quarterly investor packages typically requires 3-5 full days of work. You compile financial statements for the quarter and year-to-date, create occupancy trend charts, summarize leasing activity (new leases, renewals, expirations), benchmark performance against comparable properties, write market commentary explaining local conditions, and format everything into branded templates.
The workflow involves multiple systems:
Financial data from property management system
Market research from CoStar or similar platforms
Leasing details from tenant tracking spreadsheets
Photos and property updates from asset management files
Return calculations and waterfall distributions from Excel models
Each data source requires manual extraction, verification, and integration into the final document. Mistakes occur when pulling data from multiple time periods or reconciling numbers between systems that don't automatically sync.
Automated IC Memo and Deck Creation
Purpose-built AI platforms streamline quarterly reporting by centralizing data sources and automating document generation. The system maintains connections to your property management platform, conducts live source-linked market research, and generates investor-ready outputs in your preferred format.
For investment committee updates, the AI creates IC memos that include:
Executive summary with key metrics and return performance
Property-level financial statements with variance explanations
Leasing activity tables showing square footage leased, rental rates achieved, and tenant improvement costs
Market analysis with comparable property performance and submarket trends
Capital expenditure tracking against approved budgets
Risk factors and mitigation strategies
Every data point includes direct links to source documents. When the memo states that Q1 achieved 94.2% average occupancy, clicking that figure opens the underlying occupancy reports from your PMS. When market rent growth is cited at 4.8%, the link connects to the specific market research report with that data.
This verifiability matters enormously during investment committee reviews. Questions about specific numbers get answered instantly by referencing the source data rather than requiring follow-up research and subsequent meetings.
Platforms offering advanced portfolio management capabilities demonstrate how automation extends beyond simple data compilation to strategic analysis and scenario modeling.
How AI Automates Portfolio Reporting
The technical mechanics behind AI for reporting in real estate determine whether platforms deliver genuine automation or just slightly faster manual processes. True automation requires direct system integration, autonomous multi-step task execution, and continuous learning from ingested data.
Direct PMS Integration Architecture
Generic AI tools require you to export data from property management systems, upload files, and prompt the AI to analyze them. Purpose-built platforms eliminate these manual steps through direct API connections to Yardi, RealPage, Entrata, and other property management systems.
The integration architecture enables:
Scheduled data synchronization (nightly, weekly, or real-time)
Bidirectional data flow for both extraction and updates
Automatic schema mapping to handle different PMS data structures
Error detection and reconciliation when source data contains inconsistencies
Once connected, the AI operates autonomously. It doesn't wait for you to remember to export last month's financials. It pulls current data on schedule, compares results against historical baselines and budgets, identifies variances requiring explanation, and generates reports without human intervention.
This autonomous operation contrasts sharply with traditional reporting workflows where someone must initiate each step manually.
Multi-Step Task Orchestration
Comprehensive reporting requires coordinating numerous subtasks. Consider creating a monthly performance package: extract financial data, calculate NOI by property, identify budget variances exceeding thresholds, research explanations for major variances, compile comparative market data, generate variance narratives, format tables and charts, and distribute the final report.
AI platforms purpose-built for commercial real estate handle these workflows end-to-end:
Data extraction from connected property management systems
Calculation execution for all standard CRE metrics
Variance identification based on configured thresholds
Root cause analysis tracing variances to specific transactions
Narrative generation explaining findings in institutional language
Document formatting into branded templates
Distribution via email or integration with document management systems
Each step feeds into the next automatically. The platform doesn't require prompting to move from variance identification to narrative generation. It understands the complete workflow and executes all steps in sequence.
Platforms like those focused on AI data analysis for real estate excel at these multi-step workflows that general-purpose AI struggles to coordinate without constant human direction.
Threshold-Based Alerting for Proactive Management
Scheduled reports provide periodic snapshots. Threshold-based alerting enables proactive intervention when metrics deviate from expected ranges before waiting for the next scheduled report cycle.
Configuring Intelligent Alerts
Effective alerting requires understanding which deviations matter. Not every variance demands immediate attention. AI for reporting in real estate allows configuration of materiality thresholds based on your portfolio's characteristics and risk tolerance.
Common threshold configurations include:
Occupancy decline >2% at individual property level
Collections rate <95% for two consecutive weeks
Operating expense variance >10% vs. budget for any category
Delinquency increase >$25,000 portfolio-wide week-over-week
Lease expiration concentration >20% in any single quarter
When thresholds breach, the system generates immediate alerts with context. Rather than just notifying you that occupancy dropped 3%, the alert explains which units became vacant, provides historical context (average turnover for that property), and flags whether the decline represents normal volatility or concerning trend.
The alerts include recommended actions based on similar historical situations. When delinquency spikes at a property, the system might reference how similar increases were resolved previously (payment plans, lease enforcement, tenant replacement) and suggest appropriate next steps.
Learning from Historical Patterns
Generic alerting systems use static thresholds. Purpose-built AI platforms learn normal ranges from historical data. A property that typically experiences 5% occupancy fluctuation receives different alert sensitivity than one that historically maintains stable 95% occupancy year-round.
This learning improves as more data gets ingested. Six months of history establishes baseline patterns. Two years of data captures seasonal variations. Five years across a full portfolio enables the AI to recognize macro trends, understand which variance patterns resolve naturally versus those requiring intervention, and calibrate alert sensitivity to minimize false positives while catching genuine problems early.
The accuracy improvement from data ingestion represents a fundamental advantage of purpose-built platforms. Generic AI tools don't retain institutional knowledge about your portfolio's specific characteristics. Purpose-built systems become smarter about your assets over time.
What PMS Systems Does AI Connect to for Reporting
Integration capabilities determine whether AI for reporting in real estate delivers genuine automation or requires manual data bridging. The property management system landscape includes dominant platforms with different data structures, API capabilities, and integration complexity.
Major Platform Coverage
Enterprise-grade AI reporting platforms maintain native integrations with the property management systems used by institutional asset managers:
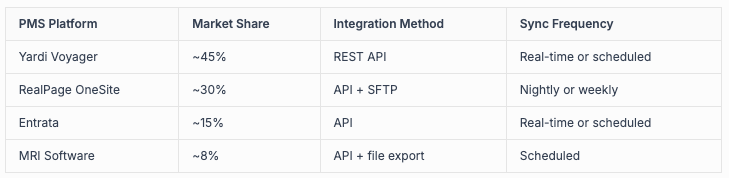
The integration method matters significantly. REST API connections enable real-time data synchronization and bidirectional updates. SFTP file transfers work reliably but typically operate on scheduled batches (nightly or weekly). Hybrid approaches combine API access for transactional data with file exports for bulk historical information.
For asset managers evaluating real estate investment analysis software, understanding these integration architectures reveals which platforms can truly automate reporting versus those requiring manual data preparation.
Data Scope and Granularity
Connection to a property management system doesn't guarantee access to all reporting-relevant data. Comprehensive AI reporting requires extraction of:
Financial data: GL transactions, accounts receivable aging, accounts payable, capital expenditure tracking
Operational metrics: Occupancy by unit and property, move-ins and move-outs, renewal rates, average days vacant
Leasing information: Rent rolls, lease expirations by quarter, rental rate trends, tenant improvement costs
Maintenance records: Work orders by category, vendor spend, recurring vs. one-time repairs
Platforms with deep PMS integration extract data at transaction level rather than summary level. This granularity enables the AI to trace specific variances to individual entries (the exact invoice causing an expense spike) rather than just reporting aggregate numbers.
The distinction between summary-level and transaction-level integration determines whether automated narratives can reference specific source documents or only provide general explanations.
Security and Compliance for Institutional Reporting
Financial and operational data from commercial real estate portfolios contains sensitive information about tenant payment histories, property performance, and investment returns. AI platforms accessing this data must meet institutional security standards.
SOC 2 Type 2 Certification Requirements
SOC 2 Type 2 certification represents the baseline security standard for platforms handling institutional real estate data. This certification verifies that the platform maintains appropriate controls across five trust service criteria: security, availability, processing integrity, confidentiality, and privacy.
The distinction between Type 1 and Type 2 matters significantly. Type 1 reports verify that controls exist at a specific point in time. Type 2 reports verify that those controls operated effectively over an extended period (typically 6-12 months). For platforms connecting to property management systems containing millions of dollars in transaction data, Type 2 certification provides necessary assurance.
Asset managers should verify:
Current SOC 2 Type 2 report availability (not just Type 1)
Certification scope includes all relevant systems (not just subset)
Third-party auditor credentials and reputation
Frequency of recertification (annual is standard)
Platforms designed for enterprise real estate teams typically maintain SOC 2 Type 2 certification as a prerequisite for institutional adoption.
Data Retention and Access Controls
Beyond certification, practical security requires robust access controls and clear data retention policies. AI reporting platforms should support:
Role-based access controls limiting which team members can view reports for specific properties or portfolio segments. An asset manager covering the Western region shouldn't automatically access Eastern region data.
Audit logging that tracks every data access, report generation, and system configuration change. When questions arise about who ran which reports or modified thresholds, complete audit trails enable investigation.
Data encryption both in transit (TLS 1.3 or higher for API connections) and at rest (AES-256 for stored data). Property management system credentials and tenant information require protection from potential breaches.
Configurable retention policies that comply with recordkeeping requirements while enabling data deletion when no longer needed. Some jurisdictions require retaining financial records for 7+ years, while other data types have shorter retention requirements.
These technical controls matter because AI tools designed for commercial real estate reporting handle data that directly impacts property valuations, investor returns, and regulatory compliance.
Accuracy Improvement Through Data Ingestion
AI platforms differ fundamentally in how they handle institutional knowledge. Generic tools process each query independently without retaining context. Purpose-built platforms improve accuracy by learning from historical data, portfolio-specific patterns, and correction feedback.
Continuous Learning Architecture
When you first deploy AI for reporting in real estate, the platform understands general commercial real estate concepts but lacks knowledge about your portfolio's specific characteristics. As it ingests more data, accuracy improves across multiple dimensions:
Variance explanation accuracy increases as the system builds historical context. After analyzing 12 months of operating expenses, the AI recognizes that utilities spike every January due to heating costs rather than flagging this as an anomaly requiring investigation.
Benchmark calibration improves when the platform compares property performance across your full portfolio rather than relying on generic market data. Your Class B multifamily properties in secondary markets operate differently than national averages, and the AI learns these nuances.
Narrative quality advances as the system observes which explanations you edit or approve and which require revision. If you consistently expand AI-generated variance explanations to include more operational context, the platform adapts future outputs to match your preferred detail level.
This learning operates continuously rather than requiring manual retraining. Each month of additional financial data, each new property added to the portfolio, and each user interaction refines the AI's understanding of your specific reporting needs.
Verification Through Source Linking
Accuracy improvements mean little without verification mechanisms. Purpose-built platforms distinguish themselves by providing direct links to source documents for every data point in generated reports. When a monthly summary states that repairs and maintenance exceeded budget by $12,400, clicking that figure opens the specific work orders and invoices totaling that amount.
This verification capability serves multiple purposes:
Investor confidence: Limited partners can verify reported numbers against source data
Audit efficiency: Year-end auditors access supporting documentation instantly
Error detection: Discrepancies between reported figures and source data surface immediately
Institutional knowledge: New team members understand how metrics are calculated
The combination of improving accuracy through data ingestion and constant verifiability through source linking creates reporting outputs that institutional stakeholders trust. Generic AI tools that generate plausible-sounding narratives without source backing require manual verification before distribution, eliminating much of the time savings that automation promises.
AI for reporting in real estate transforms portfolio operations by automating the data extraction, calculation, and narrative generation that traditionally consumed days each month. Purpose-built platforms deliver threshold-based alerts, connect directly to property management systems, and improve accuracy as they ingest more portfolio data. Leni provides this purpose-built AI analyst platform designed specifically for commercial real estate asset managers, automatically generating weekly performance summaries, budget variance analyses, and investor-ready reports while maintaining SOC 2 Type 2 security standards. Experience how autonomous reporting automation transforms your portfolio operations.

Johanna Gruber
Johanna has spent the last 8 years helping marketing teams connect with audiences through content. Specializing in B2B SaaS and real estate.
Curious About AI?
Join the largest AI community for real estate online. Get bite-sized, real-world use case videos, plus practical tips and proven strategies from top industry experts on adopting AI effectively.
MEET LENI
AI SuperAgent Purpose Built for Investors and Operators.
Experience how professionals and teams in your domain are getting the edge using AI.