How to Benchmark Multifamily Operating Expenses per Unit
How to Benchmark Multifamily Operating Expenses per Unit
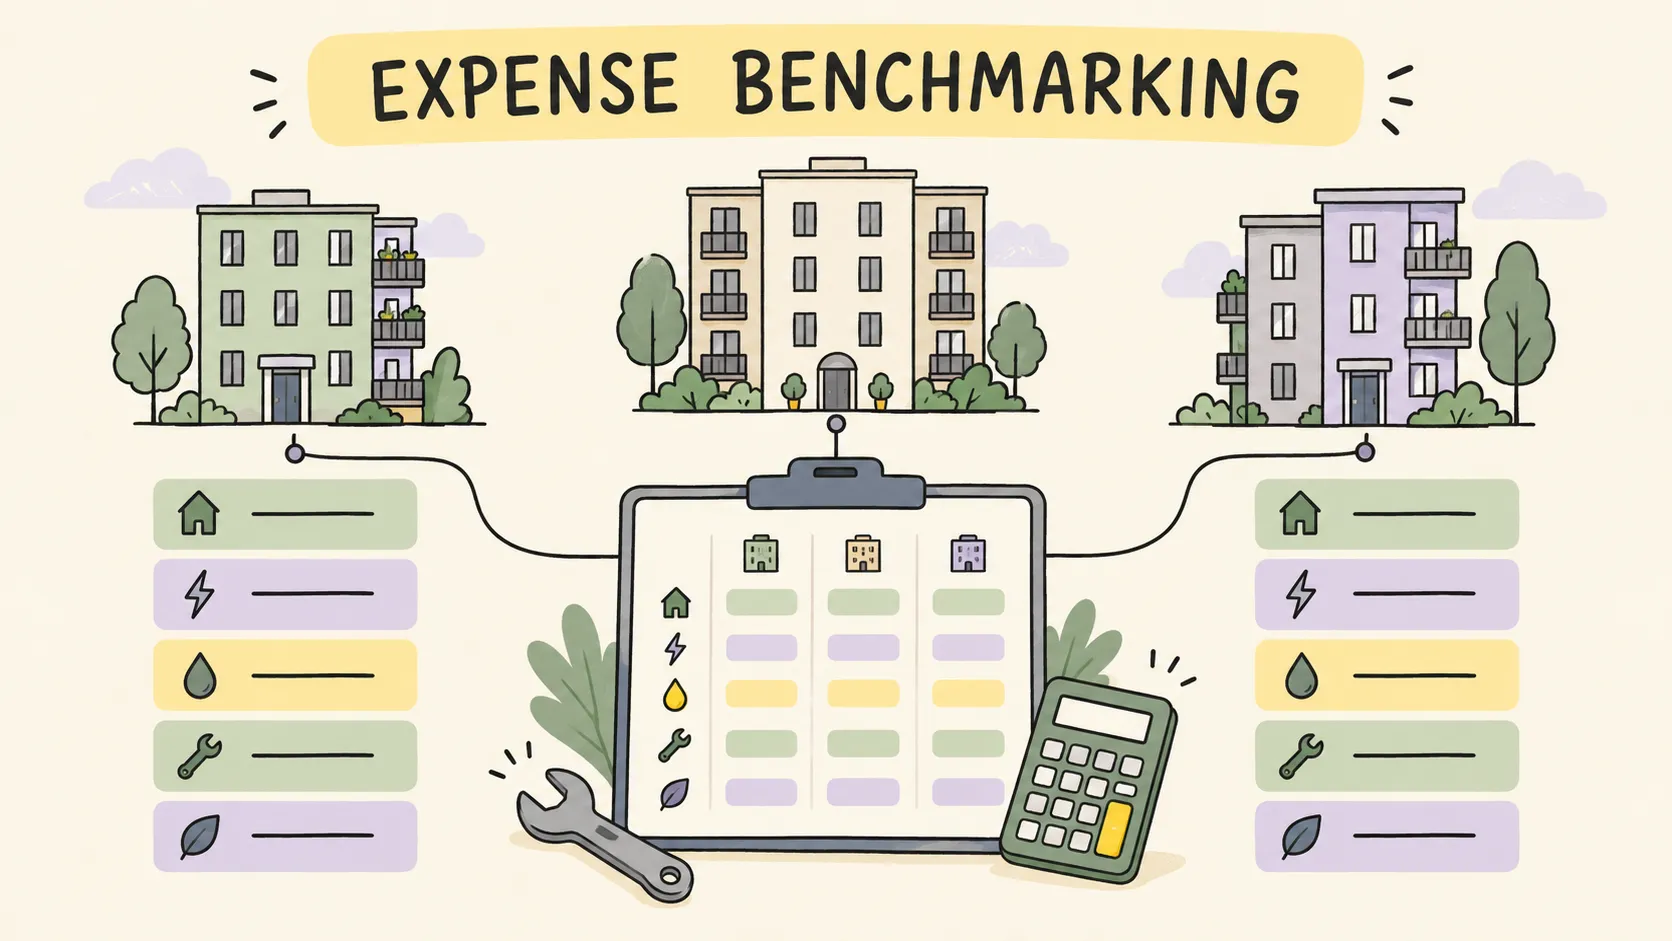
To benchmark multifamily operating expenses per unit, divide comparable operating costs by a clearly defined unit count for the same period, then compare properties with similar operating characteristics. The division is easy. The difficult part is making sure the accounts, units, and service levels mean the same thing.
A low expense figure is not automatically a good result. It might reflect efficient operations, a different utility arrangement, missing accruals, or maintenance that has been postponed.
Define what the comparison is meant to answer
Choose the decision before building a ranking. You might want to investigate a maintenance outlier, compare vendors, review a budget, or understand why an operator’s costs increased.
Each question needs a different comparison group. A lease-up and a stabilized property should not be treated as interchangeable. Neither should a garden-style property and a staffed high-rise.
Record the property set, dates, currency, accounting basis, and exclusions at the top of the analysis. For a cross-border portfolio, keep local-currency comparisons visible. Converting currency does not remove differences in services, taxes, or accounting treatment.
Calculate the measure consistently
For a full year with a stable unit count:
Annual operating expenses per unit = annual operating expenses ÷ total units
A fictional 200-unit property with USD 1,200,000 of annual operating expenses has annual expenses of USD 6,000 per unit, or USD 500 per unit-month. These are illustrative numbers, not a market benchmark.
When the property count or unit count changes, use a time-weighted denominator. For monthly reporting, expense divided by the relevant unit-months avoids treating a property owned for six months as though it contributed a full year of operations. Disclose how acquisitions, dispositions, and unavailable units are handled.
Do not silently switch from total units to occupied units. Expenses per occupied unit answers a different question and can rise simply because occupancy fell.
Normalize categories before comparing operators
One manager may report contracted maintenance under repairs. Another may use a separate vendor-services account. Comparing the repairs lines alone could create a false outlier.
Consider this fictional annual comparison:
Category, per unit | Property A | Property B |
|---|---|---|
Repairs | USD 1,400 | USD 1,100 |
Contracted maintenance | USD 800 | USD 1,100 |
Combined maintenance scope | USD 2,200 | USD 2,200 |
The initial difference disappears after matching the scope. Preserve the original accounts alongside the reporting categories so a reviewer can trace how the comparison was assembled.
Use your approved accounting policy to separate operating costs from capital spending. Reclassifying a cost to make a property look better does not improve the underlying economics.
Compare a small set of useful views
Build the review around four views:
Total expenses per unit: the overall cost trend.
Category expenses per unit: where the movement is concentrated.
Operating expense ratio: the relationship between expenses and effective gross income.
Service and condition measures: whether lower cost coincides with slower repairs, more repeat work, or another operational problem.
Treat each view as a question generator. A property with higher maintenance cost may have completed necessary work that a cheaper peer still needs.
Separate timing from a recurring difference
Before calling an expense excessive, check whether it includes an annual invoice, an accrual adjustment, an unusual repair, or a contract covering a different service level.
Ask for the supporting invoice or contract when the explanation depends on it. Put confirmed recurring costs, timing items, and unresolved items in separate groups. That makes the follow-up more useful than a league table of “best” and “worst” properties.
Where Leni fits
Leni’s Universal Data Model provides a shared structure for supported, authorized source data. The context and semantic layers help keep reporting definitions consistent.
A useful request is:
Compare maintenance expenses per total unit for the same properties and closed months. Show the account mappings, separate one-off items, and flag differences in unit counts or service scope before ranking the properties.
The exact analysis depends on the connected data and approved implementation. Public market data can add context, but it should not be represented as a like-for-like property benchmark without checking its coverage.
Questions from portfolio teams
Is there one good operating-expense figure per unit?
No single figure is appropriate for every property. Compare similar assets and explain the cost scope, period, and service model. A number without those details can mislead.
Can we compare properties using different management systems?
We can help organize supported data into consistent categories. Your team should approve the mappings and exceptions before using the results to evaluate operators.
Should we cut every cost that is above the portfolio average?
No. Investigate the reason first. Necessary maintenance, safety, resident service, and differences in property condition belong in the decision.

Leni
Purpose-built AI analyst for investment finance and real estate. Leni runs persistent workflows across underwriting, market research, memos, and reporting so teams can move faster with higher confidence.

Curious About AI?
Join the largest AI community for real estate online. Get bite-sized, real-world use case videos, plus practical tips and proven strategies from top industry experts on adopting AI effectively.
MEET LENI
AI SuperAgent Purpose Built for Investors and Operators.
Experience how professionals and teams in your domain are getting the edge using AI.
