Portfolio performance reporting: test occupancy rollups
Portfolio performance reporting: test occupancy rollups
A portfolio dashboard can show a plausible occupancy rate and still answer the wrong question. Before you accept a real estate data warehouse for portfolio performance reporting, ask it to show the occupied units, total units and property list behind the percentage.
Use the example below as a small acceptance test. It checks whether the report combines two managers' records correctly, makes missing data visible and gives an AI assistant the same reporting definition.
Start with one date and one definition
For this fictional example, physical occupancy means units physically occupied divided by total units in the selected properties at the same month-end. Both properties have complete records. There are no model, employee or offline units in the example.
Before using real data, record how those exceptions are treated. Keep signed-but-not-yet-occupied units separate from physically occupied units. Specify whether the report measures one date or an average across a period. Our physical and economic occupancy guide explains why the definition matters.
Work the two-property example
These figures are invented to test the calculation. They are not a customer result or a market benchmark.
| Property | Occupied units | Total units | Physical occupancy |
|---|---|---|---|
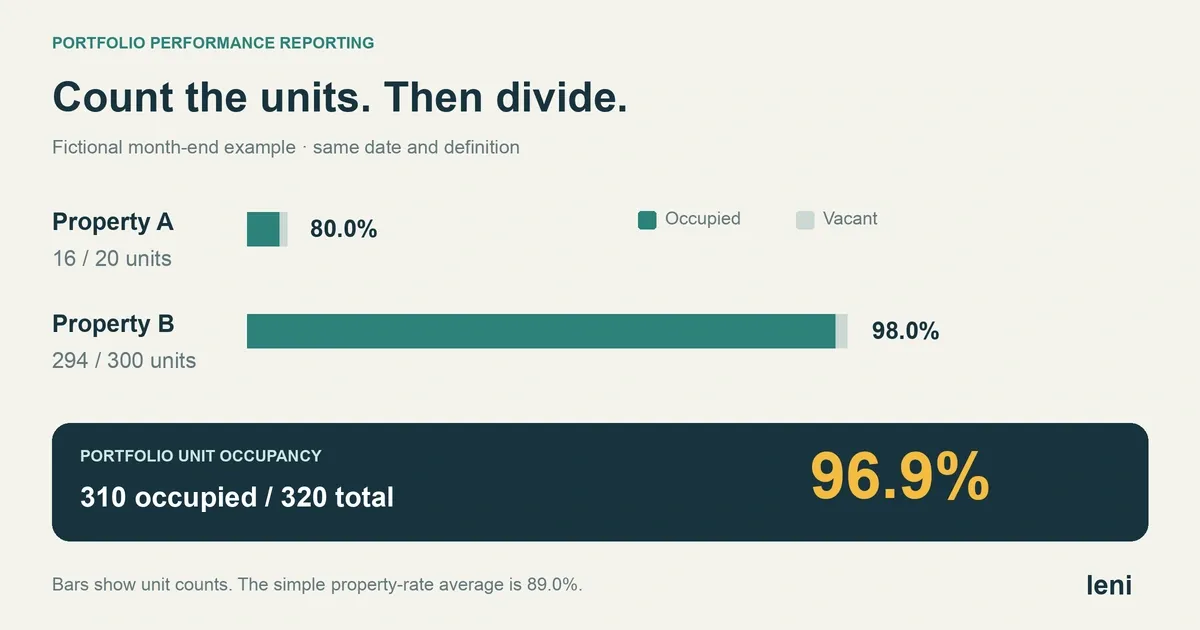
| Property A | 16 | 20 | 80.0% |
| Property B | 294 | 300 | 98.0% |
| Portfolio | 310 | 320 | 96.9% |
Add the occupied units, add the total units, then divide: 310 ÷ 320 × 100 = 96.875%, displayed as 96.9%.
The simple average of 80% and 98% is 89%. That is the average of two property percentages, with each building given equal weight. It is not the share of portfolio units occupied. A 20-unit building should not carry the same weight as a 300-unit building when the question is about units.
Keep the underlying counts and full calculation precision. Round the result for display after the calculation. A report that stores only the two rounded percentages cannot reliably reproduce the portfolio figure.
Check the records behind the total
Ask the implementation team to return the following evidence from the same test:
- A property-and-unit list. Show the source system, source property ID and source unit ID, with their mapped warehouse identifiers. Unit 101 in two different properties must remain two separate units.
- One status per unit at the cutoff. Check that a join to lease history or documents does not count a unit twice. Retain the source status and the rule used to select the applicable record.
- A count check. Match each property's occupied and total units to its approved source report at the same date. Explain each difference before accepting the combined result.
- A definition record. Save the formula, included unit statuses, cutoff and rule version with the report. A reviewer should be able to reproduce the calculation.
Make a missing property visible
Next, remove Property B's current extract from the test copy. The report must not quietly present Property A's 80% as a complete portfolio result.
Show that one of two expected properties has current data. Identify the missing property and the date of its last available extract, subject to the viewer's access. If the workflow allows a partial report, label its scope clearly. If it uses older data, show each source date. Do not mix dates under an unqualified month-end label.
Run the same check under a user who can see only Property A. The permitted result may be 80%, but it must describe that authorized property scope. It must not reveal Property B's records or imply that the user sees the full portfolio.
Separate portfolio changes from property performance
When a property is acquired, sold or excluded, the portfolio percentage can change even if occupancy at the continuing properties stays constant. Save the selected property list for each reporting date.
If you add a same-property comparison, define the common property set and use it for both dates. Display the all-property result separately. Record any changes to unit inventory or classification within the continuing properties. The label alone does not make two populations comparable.
Occupancy also does not explain an income change by itself. For that separate review, see why NOI can fall when occupancy rises.
Give the AI the same reporting contract
Use a concrete acceptance prompt: “Show month-end physical occupancy for my authorized properties. Include occupied and total units, source dates, property coverage and the calculation definition. Identify missing data before writing the summary.”
Compare the answer with the approved report and the underlying counts. A manager's note or lease document can explain an exception, but it should not silently replace the selected unit-status record. Keep the document reference, effective date and reviewer decision with the exception.
Leni's real estate data warehouse service maps supported property and finance sources to shared definitions and can connect an existing warehouse to AI workflows. Your team approves the definitions and resolves exceptions. Start with two properties, one date and this calculation before expanding the reporting scope.

Gaurav Madani
Revenue leader and co-founder with sales and go-to-market background; MBA (Schulich). Earlier roles include Zomato and strategy/communications positions.

Curious About AI?
Join the largest AI community for real estate online. Get bite-sized, real-world use case videos, plus practical tips and proven strategies from top industry experts on adopting AI effectively.
MEET LENI
AI SuperAgent Purpose Built for Investors and Operators.
Experience how professionals and teams in your domain are getting the edge using AI.